Biology Reference
In-Depth Information
In this assay we used a part of the coding region of
glyceraldehyde-3-phosphate dehydrogenase (GAPDH) as Dicer
substrate. The substrate was built up of an unlabeled sense strand,
which was hybridized to an antisense strand fluorescently labeled at
its 5′ end (Fig.
1a
). To facilitate optimal substrate binding as well
as Dicer cleavage we designed a dsRNA containing a typical two-
nucleotide 3′ overhang [
9
,
10
]. The substrate was cleaved into
three smaller products: a non-fluorescent 21-nucleotide dsRNA, a
uridine 5′ phosphate, and a fluorescing five-nucleotide-short
single-stranded RNA (ssRNA) (Fig.
1b
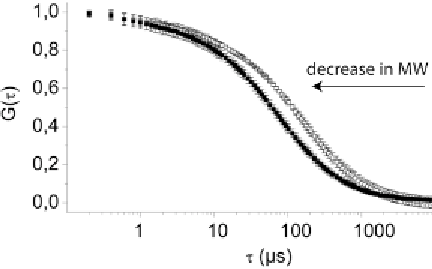
). The plotting of resulting
autocorrelation curves of substrate and cleavage product demon-
strates differences in diffusion time (Fig.
2
).
In addition to the assay outlined several control experiments
can be performed. The usage of two different fluorophores verifies
Fig. 1
Dicer substrate. (
a
) dsRNA Dicer substrate deduced from the coding region
of GAPDH mRNA with a two-nucleotide protruding 3
′
end. Antisense RNA strand
possesses a fluorescence label at its 5
′
-end; sense strand is not labeled.
Arrows
indicate putative cleavage sites. (
b
) Cleavage products after incubation with
Dicer are a non-fluorescent 21-nucleotide dsRNA, a uridine 5
′
phosphate, and a
fluorescing five-nucleotide-long ssRNA
Fig. 2
Autocorrelation functions. Experimentally determined autocorrelation
functions of Dicer substrate labeled with ATTO647N (
open boxes
) and cleavage
product (
(filled boxes
).
Arrow
indicates that components with lower molecular
weight (MW) show autocorrelation function curves shifted to the
left