Information Technology Reference
In-Depth Information
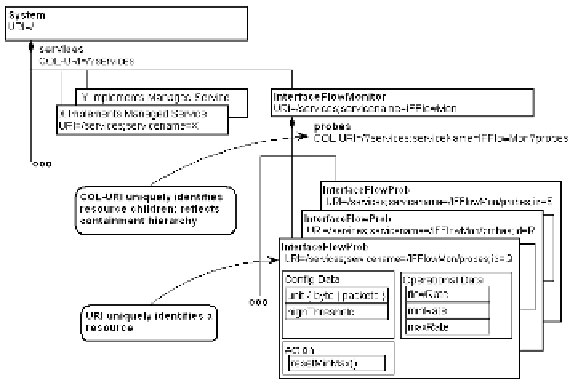
To illustrate the result of some of the API design choices made, a high-level
implementation example is provided. For the sake of brevity, a simple
Interface Flow Monitor was selected. This component monitors the flow of
bytes or packets per second across a network interface and sends and event
when a configured high threshold is exceeded. Additionally, it maintains the
minimum and maximum observed flow rates and provides the capability to
reset this operational data. The model for this component is shown in
figure
3
.
Fig. 3.
Illustrates the model of the Interface Flow Monitor component
.
The Instrumentation CRUDx API generated from the Interface Flow
Monitor model is shown below in pseudo code.
errorcode createIntefaceFlowProb(Session);
value readIntefaceFlowProb_unit(ErrorOut);
value
readIntefaceFlowProb_highThreshold(ErrorOut);
value readIntefaceFlowProb_flowRate(ErrorOut);
value readIntefaceFlowProb_minRate(ErrorOut);
value readIntefaceFlowProb_maxRate(ErrorOut);
errorcode deleteIntefaceFlowProb();
errorcode InterfaceFlowProb_resetMinMax();
These functions have direct interaction with the instrumentation and are
called
by
middleware
in
response
to
middleware
API
originated
instrumentation access requests.
Search WWH ::

Custom Search