Agriculture Reference
In-Depth Information
potential (y
s
) is caused by the salts dis-
solved in the soil solution. An approximate
relation is y
s
= 0.036 EC, expressing y
s
in
MPa, and EC in dS m
−1
. The gravitational
potential (y
g
) depends on the elevation of
the particular point. The pressure potential
is caused by the external pressure exerted
by the soil's atmosphere and is usually
neglected (except in waterlogged soils).
Normally, under saline conditions and
around field capacity, the main component
of the water potential is the matrix potential
(y
m
). Its value is negative. In practice, the
absolute value of y
m
is used, which is called
matrix tension.
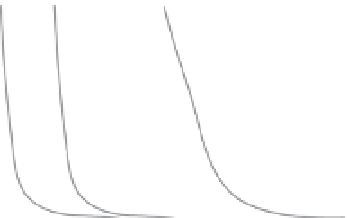
The characteristic moisture curve of a
soil, or water retention curve, represents the
relationship between matrix potential (or
tension) and water content (Fig. 11.1).
Field capacity (FC)
The field capacity of a soil is the amount of
soil moisture or water content held in the
soil after excess water has drained away
freely for 1 or several days. As most soils do
not drain until they have retained a certain
amount of water and then retain it indefi-
nitely, the definition of field capacity is ide-
alized and the concept applies more to soils
with a gross texture (i.e. with a large particle
size) (Table 11.1).
Given the existence of soil layers that
interfere with the movement of the water in
the soil as well as possible water tables, it is
convenient to measure the field capacity
in situ
(Castilla and Montalvo, 1998).
Permanent wilting point (PWP)
The permanent wilting point of a soil is
the water content below which the plant
wilts and water absorption from the soil
ceases.
Like the field capacity, PWP it is not a
constant of the soil and does not depend
only on it. There is no unique value of
water content for which the plants stop
extracting water. For instance, a plant
under a low evaporative demand can
extract more water from a soil than if the
demand is higher, because it has more time
for absorbing water. On the contrary, if the
evaporative demand is high the plant can
temporarily wilt with water content in the
soil that is higher than the permanent wilt-
ing point.
Sandy
Sandy-loam
Silty-clay
Humidity
Fig. 11.1.
The retention curve, or characteristic
moisture curve, of a soil represents the relationship
between the moisture content and the matrix
tension (absolute value of the matrix potential).
Table 11.1.
Field capacity (FC), permanent wilting point (PWP) and readily available water (RAW) for
soils with different textures.
Moisture content (% dry weight)
Available water
holding capacity
(mm m
−1
)
b
Soil texture
FC
PWP
RAW
Sandy
6-12 (9)
a
2-6 (4)
5
85
Sandy-loam
10-18 (14)
4-8 (6)
8
120
Loam
18-26 (22)
8-12 (10)
12
170
Clay-loam
25-31 (27)
11-15 (13)
14
190
Silty-clay
27-35 (31)
13-17 (15)
16
210
Clay
31-39 (35)
15-19 (17)
18
230
a
Average value in parentheses.
b
Available water holding capacity expressed in millimetres of water per metre of soil depth.