Information Technology Reference
In-Depth Information
faster, more complete defect discovery than your prior manual testing approach. If
you cannot fi nd evidence for this unexpected testing boost, then consider the curve
difference nonpredictive at best and a warning that you may be getting a false indica-
tor of success from your defect log reports.
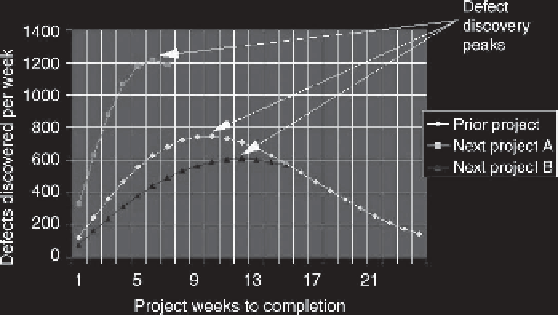
Project B in Figure 12.12 is an example of the curve for your next project if you
have started fi nding fewer defects later in the development cycle than you did in
your prior project. Recall that situation is an undesirable trend, implying that your
testing approach this time may be less effective in fi nding defects over the life of the
development. In this case, an early indication of less effective testing should cause
you to ask why. What was included in the prior project testing that may have been
omitted or missed in either the planning or test execution startup this time ? After
you have done this project-to-project comparison for several projects, a new exciting
explanation could arise for Plot B. If the whole development team has actually taken
the time and effort to fi nd ways to improve the software development steps, then it is
possible that Plot B is a clear, measurable indication that the development improve-
ment effort is paying off with fewer defects to be discovered by testing. If you cannot
fi nd evidence for either a testing lag or a testing boost, then consider the curve dif-
ference nonpredictive, but consider the trend worth further scrutiny.
12.6.4 Leveraging Prior Project Defect History as the
Next Project
Continues
Continue to monitor and plot the defect discovery curve as the development project
reaches each subsequent milestone. Sometime during the development project, usu-
ally about one-third of the way into the project, the defect discovery rate (number of
defects discovered per week) will peak out and begin to decline. This point of infl ec-
tion in the discovery curve tends to be a prediction anchor point for most defect analy-
ses. Figure 12.13 includes the project curves from Figure 12.12 plotted to their defect
discovery peaks that have been observed during all three development projects.
Figure 12.13
Defect tracking log comparison
Search WWH ::

Custom Search