Information Technology Reference
In-Depth Information
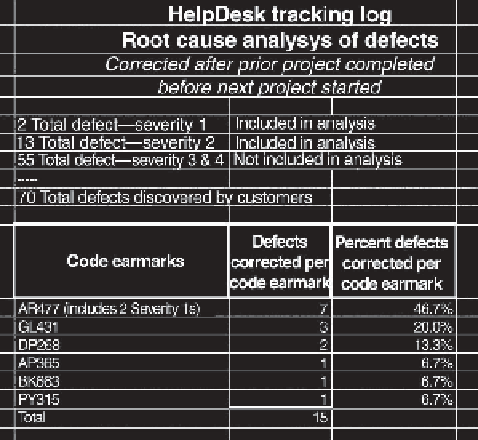
Figure 12.11
Root cause analysis of customer-identified defects
From this analysis we see three code earmarks contributing the majority of the
customer-discovered defects. If we return to the defect backlog analysis in Figure 12.7
and compare results with the customer-discovered defects, we learn two valuable facts.
First, the backlog analysis correctly identifi ed concern with one particular code
earmark as a dominant source of development defects, namely AR477. The fact
that the same code earmark also appears as a dominant source of customer defects
confi rms the validity of the backlog analysis conclusions and, unfortunately, the fact
that development did not take suffi cient remedial action in AR477 before develop-
ment was completed.
Second, the customer defect analysis identifi ed code earmark GL431 that was
not observed in the backlog analysis. It would be instructive for the next development
project to determine the source of this surprise. The answer could be as simple as
incorrect code earmark guesses prior to the backlog analysis. The answer could be
as complex as incomplete test coverage whereby some aspect of the AR477 software
under development escaped rigorous testing. Both answers may indicate process im-
provements that can be made during the next development project.
12.6.3 Leveraging Prior Project Defect History
As
the
Next Project Starts
You have collected and graphed the prior project defect history and are ready to
start your next project. You have learned three things from your last project that can
be used as predictors for your next project effort: total defects, the defect discovery
curve, and contour of defect severity.
Search WWH ::

Custom Search