Information Technology Reference
In-Depth Information
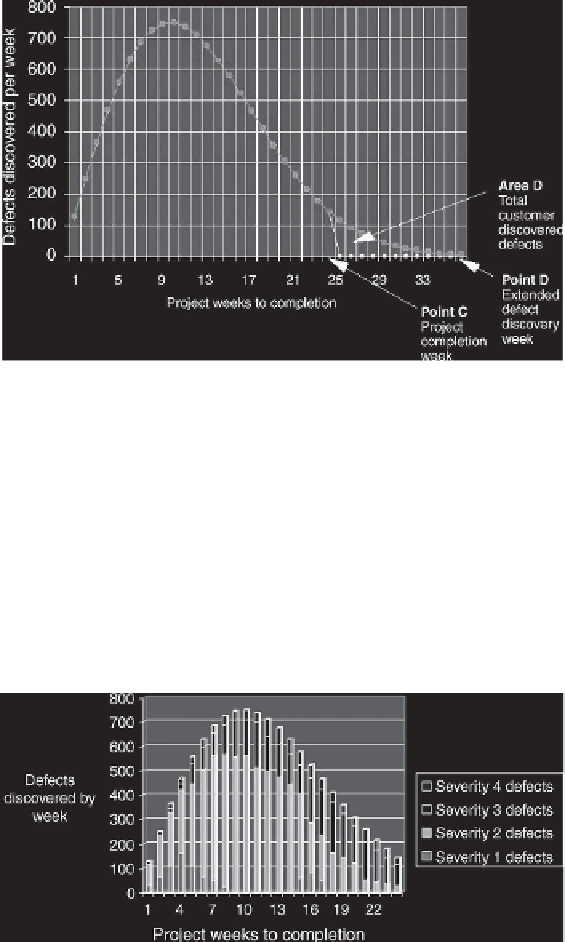
Figure 12.9
Prior development project defect tracking log extended beyond project completion
In this example, we have extended the prior defect history curve past the project
completion week to the
x
-axis. Project week 36 becomes our Point D. Area D under
the curve from Point C to Point D is 487 defects that customers might discover.
Before acting on the 487 customer defects as a prediction, we need to consider ad-
ditional information.
One additional graph from the prior development project defect tracking log
can shed additional light. Consider stratifying the defect log data in Figure 12.8
by development showstopper severity codes. A graph something like Figure 12.10
might appear.
Figure 12.10
Prior project defect tracking log by development defect severity
The graph shows what you might already know. The more severe defects
tend to be encountered early in the development cycle when the code is quite
unstable. The severity of the defects declines as the code becomes stable. Gen-
erally speaking, the discovery of very severe defects at the end of the devel-
opment project is truly bad news for any immediate plans to complete the
software.
Search WWH ::

Custom Search