Information Technology Reference
In-Depth Information
50
40
30
Work
load
peak
250
|
20
Max response time = 10 s
10
- Box A
- Box B
0
1
50
100
150
200
250
300
350
400
450
500
Number of round trip transactions
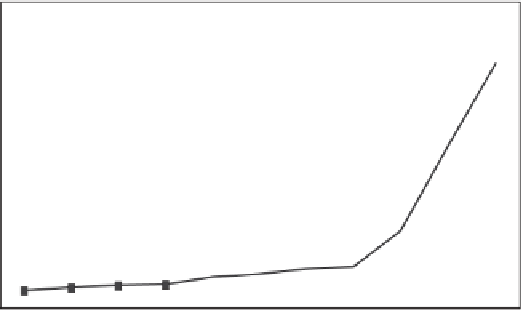
Figure 9.2
Round trip performance for catalog browse transactions
5.6 seconds, well below the 10 seconds maximum response time (arrow). Knowing
that the knee of the curve is lurking somewhere out there, you extend your peak
workload test to 350 transactions per Box B and see that the plot is still linear and
still below the 10 seconds maximum. So you have just discovered that you have at
least a 40% margin of safety with the performance requirement without seeing the
knee of the curve.
Consider the plot in Figure 9.3 with the same 10 seconds response time require-
ment maximum for a peak workload of 350 active transactions.
50
40
30
Work
load
peak
350
20
Max response time = 10 s
10
- Box B
- Box C
0
1
50
100
150
200
250
300
350
400
450
500
Number of round trip transactions
Figure 9.3
Round trip performance for catalog browse transactions


Search WWH ::

Custom Search