Information Technology Reference
In-Depth Information
for each typology, it was necessary to work for circa 76 minutes. By considering the
need for reading the related story, filling the excel, the average time of each operator
to finalise a set of games was equal to circa 90 minutes, i.e. approx 15 minutes per
game (see Tab. 3).
Ta b l e 3
Details about the revised games
GAME
n
%
Average time
WHO
25
10.00
10,6
WHAT
34
13.60
12
BEFORE/AFTER
74
29.60
12,8
BEFORE/WHILE
41
16.40
12,8
WHILE/AFTER
42
16.80
12,8
BEFORE/WHILE/AFTER
34
13.60
14,8
Total
250
100.00
75,8
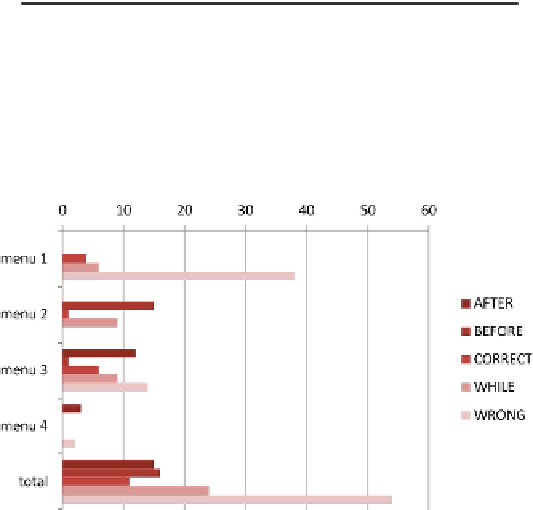
Only in the 6% of all cases, it was necessary to change the automatically gen-
erated fixed event. In 72% of games the text of the event was corrected. The total
number of changes (of both entities or choice events) was 120. The changes were
necessary especially for the wrong choices, with 54 total changes (Fig. 4).
Fig. 4
Distribution of changes
The work of developing manual causal games was instead longer, as the operator
had to invent the game by directly using, when possible, one of the fixed events
already present in the story games. Overall, 75 causal games were created (both
cause, effect, and cause/effect games). The average time spent for their development
was equal to 23 minutes per game. The total work, also including game loading and
final review, was about 30 minutes for each causal game.


Search WWH ::

Custom Search