Information Technology Reference
In-Depth Information
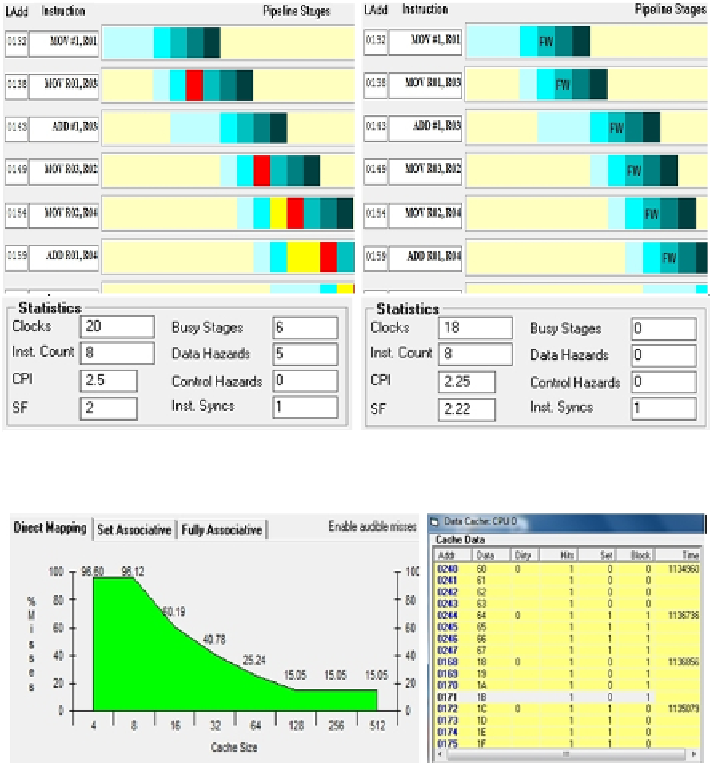
Fig. 3
CPU pipeline executing instructions in parallel, i.e. instructions are pipelined
Fig. 4
Plot of CPU cache misses against different cache sizes (left); cache data display
(right)
3.2
OS Simulator Visualizations
The OS simulator provides additional visualization challenges requiring visual re-
presentation of system management of resources such as processes and memory
involving process states, state transitions, placement, replacement, deadlock detec-
tion and resolution as well as load balancing with CPU/memory utilization.
Figure 5 shows two versions of graphical representation of process states. The
image on the right is an animated version of state transitions as the processes are
dispatched, executed or blocked. In the meantime, Process Control Blocks (PCBs)
facilitate context switching between processes an example of which is shown
in Figure 6 (right). Memory management is needed to share and protect finite
Search WWH ::

Custom Search