Information Technology Reference
In-Depth Information
in order to visually demonstrate parallel execution as opposed to sequential execu-
tion of instructions. Figure 2 shows the stages of instructions as they go through
the pipeline in serial sequence whereas figure 3 depicts parallel execution visually
highlighting the difference between the two as the instructions are executed.
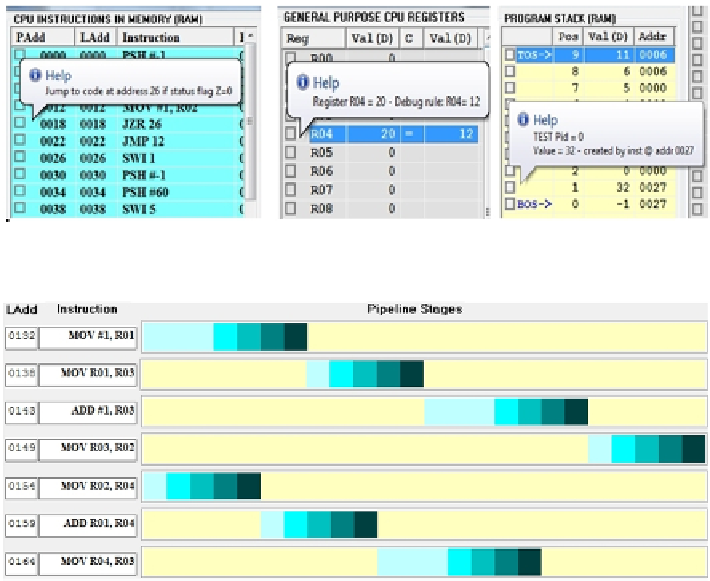
Fig. 1
CPU simulator visualizations: instructions (left), registers (middle) and stack (right)
Fig. 2
CPU pipeline executing instructions in series, i.e. no instruction pipelining
The pipeline hazards such as data dependencies and control hazards are also
represented as color-coded blocks. Figure 3 (top left) shows a section of the pipe-
line display where the red blocks (or the 1
st
dark block in 2
nd
and 4
th
to 6
th
lines in
gray-scale images) represent data hazards due to data dependencies between the
instructions. Figure 3 (top right) shows the same sequence of instructions but this
time with operand forwarding optimization enabled. Here the data hazards are ef-
fectively mitigated by operand forwarding as indicated by the blocks labeled FW.
The performance improvement is clear in the displayed statistics in Figure 3 (bot-
tom images); same number of instructions is executed in less clock cycles (i.e. 18
instead of 20). Another advanced feature included is the simulation of data and in-
struction caches. As seen in Figure 4, the structure and the contents of the caches
as well as the graphical and animated views of the miss rates are displayed for
different cache architectures and sizes allowing students to study the differences.
Search WWH ::

Custom Search