Agriculture Reference
In-Depth Information
table 2.3
equity, measured by the Gini coefficient, of Key Resources in the Intensive
study site, Kiambu district, 1997
a
Resource
Githima
Gitangu
mahindi
thiririka
Kiawamagira
Gikabu
Off-farm employment
0.72
0.61
0.43
0.68
0.53
0.35
Population
0.26
0.25
0.18
0.29
0.14
0.22
Farm land
0.44
0.35
0.23
0.27
0.28
0.40
Cattle
0.44
0.39
0.38
0.39
0.40
0.34
Sheep and goats
0.70
0.66
0.45
0.54
0.34
0.61
Income from cash
crops
0.54
0.09
0.00
0.42
0.00
0.32
Income from food
crops
0.56
0.47
0.31
0.48
0.26
0.52
Income from livestock
0.44
0.40
0.15
0.66
0.20
0.43
a
Gini coefficients were calculated using the method described by Casley and Lury (1982) as (T1-T2)/
10,000 where T1 is the sum of the cross-products of cumulative percentage of land-use units and lagged
cumulative percentage of the resource. T2 is the sum of the cross-product of lagged cumulative percent-
age of land-use units and cumulative percentage of the resource.
100
80
60
40
20
0
0
20
40
60
80
100
Farms (Cumulative %)
Githima
Gikabu
Mahindi
Gitangu
Thiririka
Kiawamagira
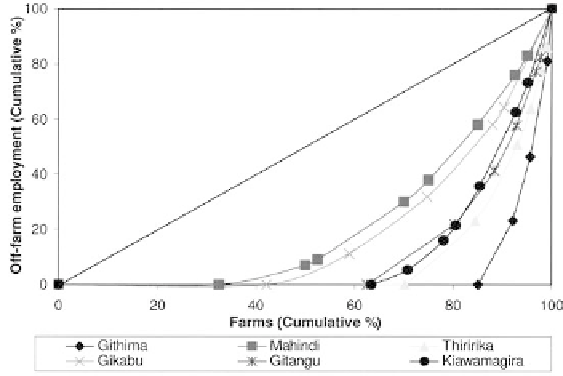
fIGuRe 2.6
Lorenz curve showing the distribution of off-farm employment in the inten-
sive study site, Kiambu District, Kenya, 1997. See CD for color image.
villages was 10 km). Private health facilities, however, were available within Gikabu,
Kiawamagira, and Githima villages.
The distribution of water supply schemes in the district relative to the study sites
and major urban centers is shown in Figure 2.12. Among the ISSs, only Githima,
Kiawamagira, and Gitangu were located within areas covered by a water supply
scheme. At the time of this study, Komothai water scheme (covering Githima study


Search WWH ::

Custom Search