Biology Reference
In-Depth Information
gauge, or CTD, measures physical conditions in the bay and feeds the information
back into the
Polaris
's lab computers. The instrument can take 25 samples per
meter, per second.
As the instrument descends to just short of the bottom and then rises back up
again, the crew works the keyboards and watches the incoming measurements
pop up on two screens. On one screen, blue, red, green, and black lines snake
their way down a graph as the instrument sends back a vertical profile of every-
thing going on in the water column. On another screen, numbers flash in white
boxes indicating GPS position, time, depth, salinity, temperature, turbidity, dis-
solved oxygen, and wind direction. When the instrument comes up dripping, the
crew leader presses the intercom and tells the captain, “Good to go.”
We repeat the same drill at a number of stations as the
Polaris
works its way
out of the southern backwaters and nears the Bay Bridge. Our top speed between
stations is about 10 knots. Our captain listens to the maritime traffic chatter on
the radio and watches a bunch of yellow dots (ships) on an on-screen nautical
chart move in and out of port. A click of a keyboard reveals the names of all other
Class A vessels over 65 feet long operating or parked in the bay at this precise
moment. This is no virtual harbor traffic game.
Past the Bay Bridge, the
Polaris
follows long trains of small white caps headed
east. I step out on deck and hold onto my hat to watch the crew undertake a spe-
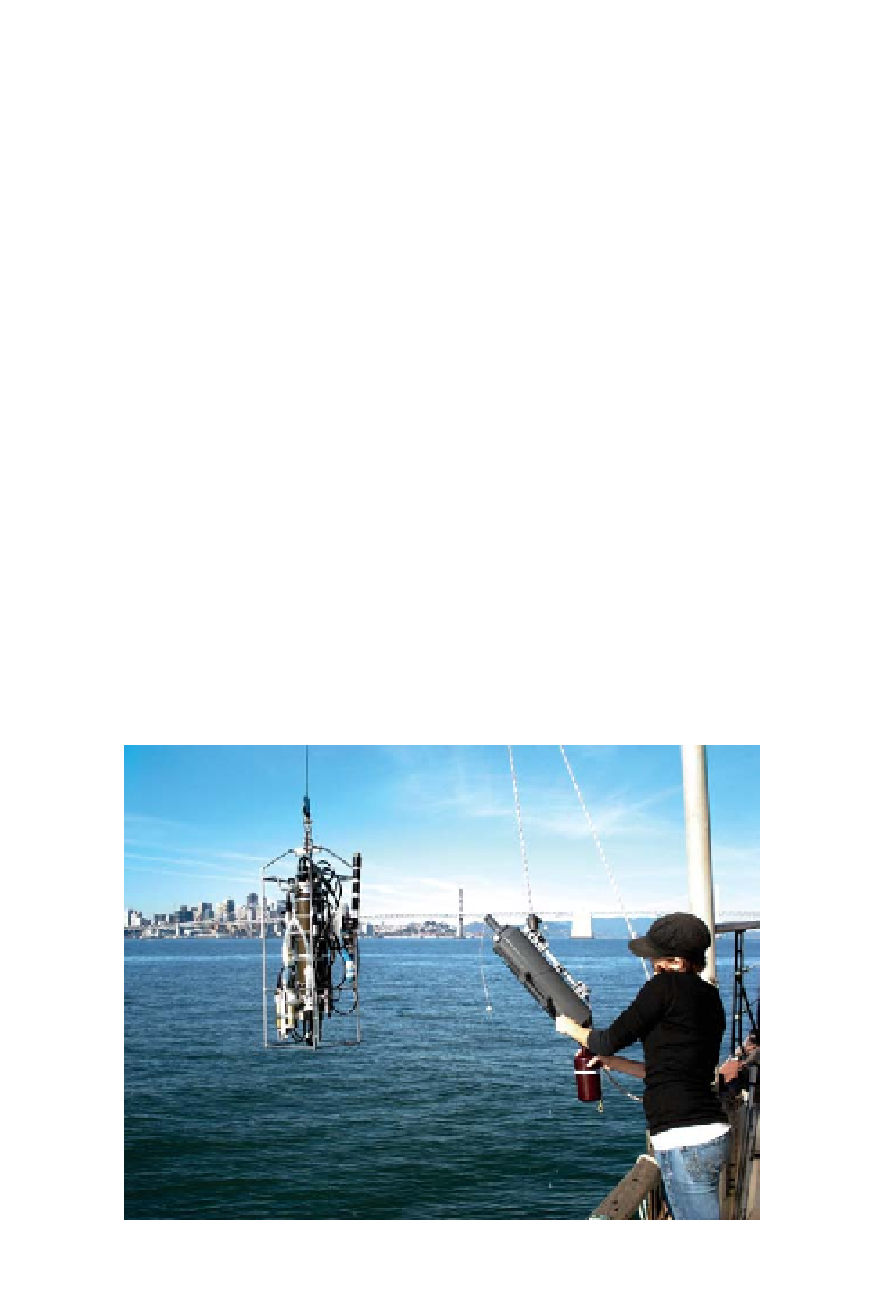
cial set of experiments with a charcoal-grey PVC canister called the Niskin bottle—
a canister with a spring-loaded stopper on either end designed to “grab” water
USGS scientist deploying a Niskin bottle (right) and CTD (left), instruments used to
measure physical conditions in the bay. (Ariel Rubissow Okamoto)