Biology Reference
In-Depth Information
TABLE 2
.
San Francisco Bay Area Commercial Fish Landings:
Lowest and highest annual catch between 1920 and 1950
in pounds
Product
Catch
Bay Shrimp
235,000-3.4 million
Dungeness Crab
715,000-5.98 million
Oysters
86,328-1.8 million
Salmon
648,000-8.5 million
Sardines
154,000-492 million
Source:
California Department of Fish and Game, J. E. Skinner report, 1962.
ports in the state. As Harold Gilliam writes, “[Those were the] great days
on the Wharf, when sardines ran in schools of countless millions along the
coast, when there were some 40 sardine canneries and reduction plants
going full blast around the Bay, when the big 16 man purse seiners were
moored so thick between piers that you could walk from one pier to the
other by climbing across their decks. . . . They used to go out the Gate at
night in the dark of the moon, and suddenly, a few miles offshore, the
water below the surface would turn white, ablaze with the phosphores-
cence stirred up by millions of sardines.” Unfortunately, the sardine boom
eventually collapsed.
Fish were not the only thing locals were pulling out of the bay for profit in
the first half of the twentieth century. Various industries grew up to har-
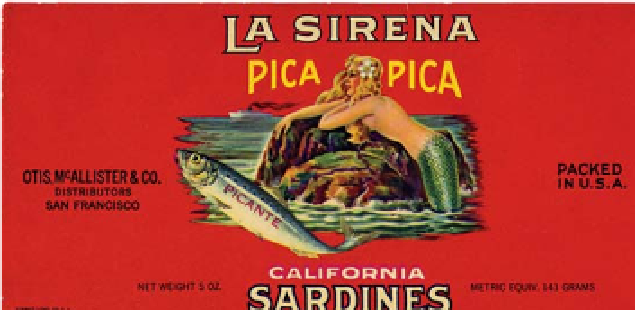
Sardine can label from San Francisco canneries. (James Bridges,
www.Sardineking


