Information Technology Reference
In-Depth Information
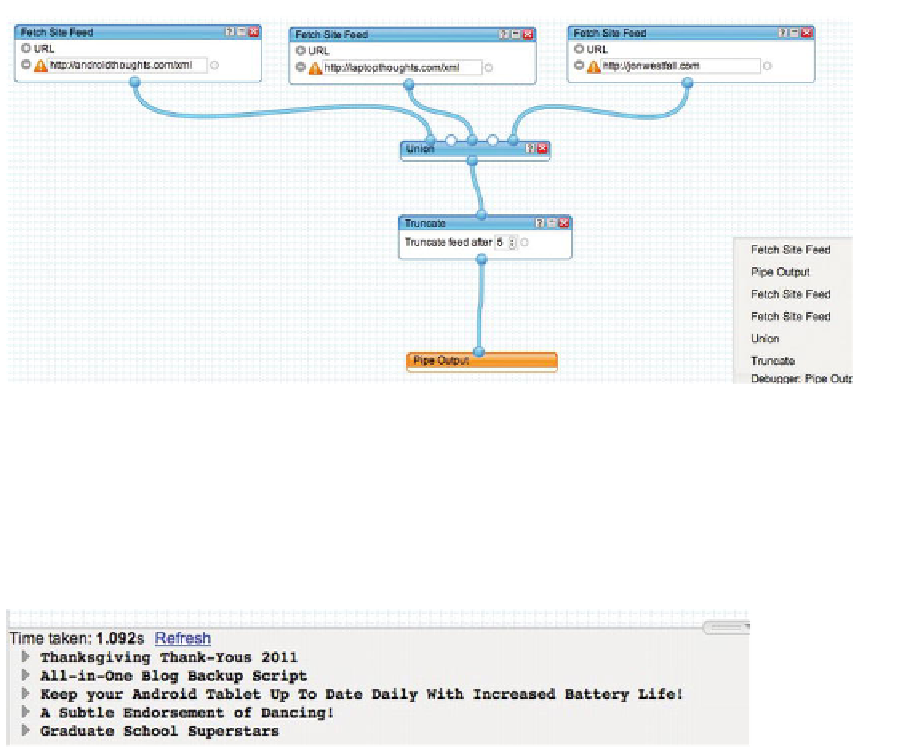
Figure 12-11.
The completed Pipe
In the debugger window (Figure 12-12), I can see what the output will look like for either
the whole Pipe or individual parts along the way. The following output (in Figure 12-12)
is shown when I click on “Pipe Output.” If I had clicked on the Union instead, I would
see all of the feed items, not just the five shown after the Truncate command. This
intermediate level of debugging is useful when debugging pipes to see which
component may be causing a problem.
Figure 12-12.
The entire output of my pipe, given that we've truncated after five items
Once you're done, click “Save” and give your Pipe a name. Then click on “Run Pipe” to
see the output (Figure 12-13).