Biomedical Engineering Reference
In-Depth Information
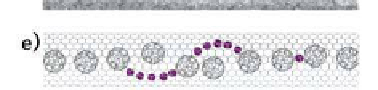
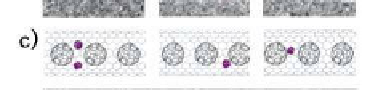
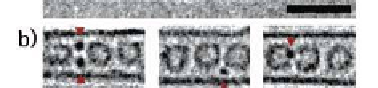
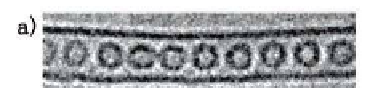
Figure 9.34
. (a) An HR-TEM image of the intact C
60
peapods. (b) HR-TEM images of
the iodine-doped C
60
peapods with low doping ratio; the black spots (indicated by
arrows) are ascribed to the doped iodine atoms. (c) The best it schematic model
(purple, iodine; gray, carbon). (d) An HR-TEM image of the iodine-doped C
60
peapods
with higher doping ratio; the bent chains (indicated by arrows) are ascribed to the
doped iodine species. (e) The schematic model. Scale bar = 2 nm. Reproduced from
Guan
et al
.
202
with permission.
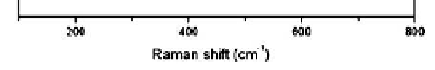
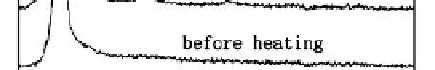
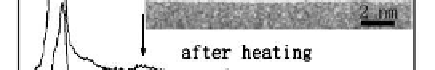
Figure 9.35
. Raman spectra of the iodine-doped C
60
@SWCNTs before and after heat
treatment. The arrow indicates the newly appearing RMB mode as the result of heat
treatment. Inserted are typical HR-TEM images of the iodine-doped C
60
@SWCNTs
after heating. Reproduced from Guan
et al
.
202
with permission.


Search WWH ::

Custom Search