Biomedical Engineering Reference
In-Depth Information
quantum approach are illustrated in Fig. 5.23: the interaction mainly involved
the
π
orbitals of the base atoms, especially the NH
2
group at its end, and the
π
orbitals of the C atoms in the CNT. Upon adsorption, the base plane was
positively charged, with electron accumulation (near the base) and depletion
near the CNT, determining a net charge transfer of 0.017
e
from the adenine
base to the CNT. Similar trends were experienced by the other bases, so the
STS tips could easily detect their characteristic signals.
a
b
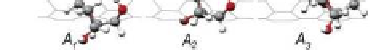
Figure 5.22.
(a) Proposed experimental setup for single base measurement: an
ssDNA fragment is in partial contact with the CNT and is being pulled at one end. (b)
Representative optimal structures of adenine on the (10,0) CNT. The gray, blue, red
and white balls represent C, N, O and H atoms, respectively. Reproduced from Meng
et
al.
82
with permission. See also Colour Insert.
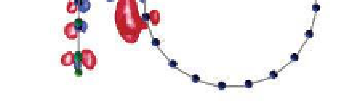
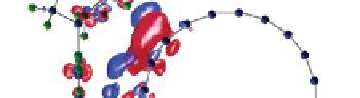
Figure 5.23
Isodensity surface of the charge density difference for adenine-CNT.
The charge density difference is calculated by subtracting the charge density of the
individual adenine (A) and CNT systems, each ixed at its respective position when it
is part of the A-CNT complex. Electron accumulation-depletion regions are shown in
blue (+) and red (-). Reproduced from Meng
et al.
82
with permission. See also Colour
Insert.


Search WWH ::

Custom Search