Biomedical Engineering Reference
In-Depth Information
1200
2000
1000
1500
800
1000
600
400
500
200
0
0
0
10
20
30
Time (min)
40
50
60
0
10
20
30
Time (min)
40
50
60
A
B
300
250
200
150
100
50
0
0
10
20
30
Time (min)
40
50
60
C
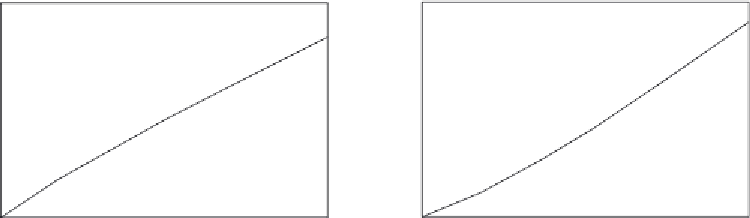
Figure 4.9
Binding of different concentrations (in mU) of methionine in solution in the cSPA (competitive
scintillation proximity aminoacyl-tRNA synthetase charging assay) (
Forbes et al., 2007
)
: (a) 0.05
(b) 0.025 (c) 0.01.
50
40
30
20
10
0
0.01
0.02
0.03
0.04
0.05
Methionine concentration (mU)
Figure 4.10
Increase in the binding rate coefficient, k with an increase in the methionine concentration (in mU)
in solution.