Biomedical Engineering Reference
In-Depth Information
200
250
200
150
150
100
100
50
50
0
0
0
20
40
Time (ms)
60
100
0
20
40
Time (ms)
60
80
100
80
A
B
70
60
50
40
30
20
10
0
0
20
40
60
80
100
C
Time (ms)
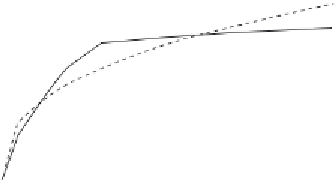
Figure 4.5
Binding of different concentrations (in micromole) of inorganic phosphate, P
i
to a biosensor
surface (
Okoh et al., 2006
)
: (a) 0.63 (b) 1.25 (c) 5. If only a solid line is used (___) then a single-
fractal analysis applies. If both a dashed (----) and a solid (___) line are used then the solid line is
the best-fit line.
are given in
Table 4.5
. It is of interest to note that as the fractal dimension increases by a
factor of 2.36 from a value of
D
f1
equal to 1.0986 to
D
f2
equal to 2.5928, the binding rate
coefficient increases by a factor of 11.77 from a value of
k
1
equal to 6.362 to
k
2
equal to
74.911 for a dual-fractal analysis. Note that an increase in the degree of heterogeneity or
the fractal dimension on the sensor chip surface leads to an increase in the binding rate
coefficient.
Figure 4.5b
shows the binding of 1.25 micromole inorganic phosphate ion (P
i
) in solution to a
rhodamine-PBP phosphate biosensor (
Okoh et al., 2006
). A dual-fractal analysis is required
to adequately describe the binding kinetics. The values of (a) the binding rate coefficient,
k
, and the fractal dimension,
D
f
, for a single-fractal analysis, and (b) the binding rate
coefficients,
k
1
and
k
2
, and the fractal dimensions,
D
f1
and
D
f2
, for a dual-fractal analysis
are given in
Table 4.5
. It is of interest to note, once again, that as the fractal dimension