Biomedical Engineering Reference
In-Depth Information
0.8
0.35
0.3
0.6
0.25
0.2
0.4
0.15
0.1
0.2
0.05
0
0
0
500
1000
1500
2000
2500
0
500
1000
1500
2000
2500
A
B
Time (s)
Time (s)
1.6
2
1.4
1.2
1.5
1
0.8
1
0.6
0.4
0.5
0.2
0
0
0
500
1000 1500
Time (s)
2000
2500
0
500
1000 1500
Time (s)
2000
2500
C
D
2.5
2
1.5
1
0.5
0
0
500
1000
1500
2000
2500
E
Time (s)
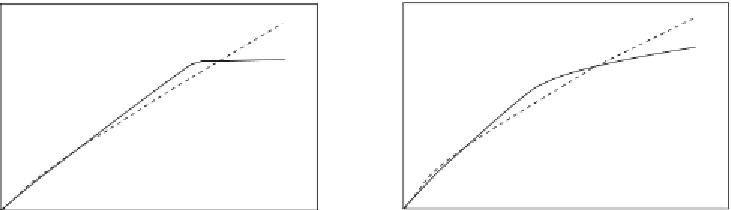
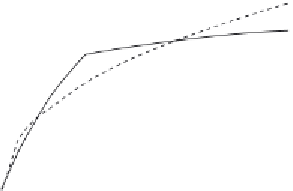
Figure 16.15
Binding (hybridization) of the complementary DNA (cDNA) to the molecular beacon (MB)
immobilized on the biosensor surface (
Li et al., 2001
). Influence of ion (MgCl
2
) concentration
(in mM) in solution: (a) 0.1, (b) 1, (c) 10, (d) 100, (e) 500. When only a solid line (--) is used then
a single-fractal analysis applies. When both a dashed (- - -) and a solid (--) line are used then the
dashed line represents a single-fractal analysis and the solid line represents a dual-fractal analysis.
It is of interest to note that as the fractal dimension increases by a factor of 1.852 from a
value of
D
f1
equal to 1.2708 to
D
f2
equal to 2.3546, the binding rate coefficient increases
by a factor of 43.77 from a value of
k
1
equal to 0.001195 to
k
2
equal to 0.05231. The changes
in the degree of heterogeneity or the fractal dimension on the biosensor surface and in the
binding rate coefficient are, once again, in the same direction.