Biomedical Engineering Reference
In-Depth Information
70
60
50
40
30
20
10
0
80
60
40
20
0
0
200
400
600
800
1000
1200
0
200
400
600
800
1000
1200
A
B
Time (min)
Time (min)
100
80
60
40
20
0
0
200
400
600
800
1000
1200
C
Time (min)
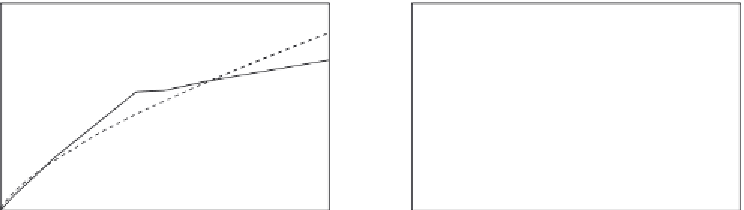
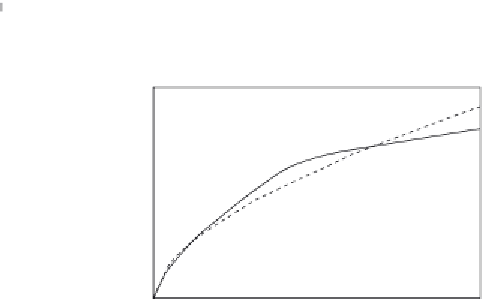
Figure 16.7
Binding (raw data) of 500 pM cy3-labelled targets to different areas on a 20-mer capture
probe spotted on glass (
Schultz et al., 2008
): (a) Area 1, (b) Area 2, (c) Area 3. When only a solid
line (--) is used then a single-fractal analysis applies. When both a dashed (- - -) and a solid (--)
line are used then the dashed line represents a single-fractal analysis and the solid line represents a
dual-fractal analysis.
dimension,
D
f
, for a single-fractal analysis, and (b) the binding rate coefficients,
k
1
and
k
2
,
and the fractal dimensions,
D
f1
and
D
f2
, for a dual-fractal analysis are given in
Table 16.5
.
For a dual-fractal analysis, it is of interest to note that as the fractal dimension increases by a
factor of 1.93 from a value of
D
f1
equal to 1.2272 to
D
f2
equal to 2.3698, the binding rate
coefficient increases by a factor of 33.29 from a value of
k
1
equal to 0.1629 to
k
2
equal to
5.4224. The changes in the degree of heterogeneity or the fractal dimension on the sensor sur-
face and in the binding rate coefficient are in the same direction.
Figure 16.7b
shows the binding of 500 pM cy3-labelled target (raw data) to a 20-mer capture
probe immobilized on Area 2 (control) on the microarray biosensor (
Schultz et al., 2008
).
It shows, once again, that a dual-fractal analysis is required to adequately describe the bind-
ing kinetics. The values of (a) the binding rate coefficient,
k
, and the fractal dimension,
D
f
,
for a single-fractal analysis, and (b) the binding rate coefficients,
k
1
and
k
2
, and the fractal
dimensions,
D
f1
and
D
f2
, for a dual-fractal analysis are given in
Table 16.5
.