Biomedical Engineering Reference
In-Depth Information
Table 16.3: Binding (phosphorylation) of FAM-SP-2 by T4 PNK by a
single-labeled DNA-hairpin smart probe with
l
exonuclease.
FAM-SP-2 concentration (nM)
k
D
f
20
281.63 16.70 2. 2322 0.0474
30
670.97 41.71
2.3148 0.0482
40
829.22
44.39 2. 2754
0.0416
50
1213.94
91.79
2.2300
0.0442
60
1145.14
97.09
2.1492
0.0480
Influence of substrate (FAM-SP-2) concentration (
Song and Zhao, 2009
). T4 PNK,
l
exonuclease and ATP concentration are 5.6 nM/s, 10 units, and 1.0 nM, respectively.
the binding rate coefficient,
k
, and the fractal dimension,
D
f
, for a single-fractal analysis is
given in
Table 16.3
.
Figure 16.4e
shows the binding of 60 nM FAM-SP-2 to T4 PNK immobilized on the sensor
surface. A single-fractal analysis is adequate to describe the binding kinetics. The values of
the binding rate coefficient,
k
, and the fractal dimension,
D
f
, for a single-fractal analysis is
given in
Table 16.3
.
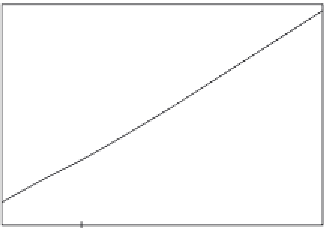
Figure 16.5
and
Table 16.3
show for a single-fractal analysis the increase in the binding rate
coefficient,
k
, with an increase in the FAM-SP-2 concentration in solution in the 20-60 nM
range in solution. For the data shown in
Figure 16.5
, the binding rate coefficient,
k
,is
given by:
1
:
307
0
:
126
ð
:
Þ
k
¼ð
6
:
502
1
:
336
Þ½
FAM-SP-2, nM
16
5
The fit is good. Only five data points are available. The availability of more data points
would lead to a more reliable fit. The binding rate coefficient,
k
, is sensitive to the FAM-SP-2
1400
1200
1000
800
600
400
200
20
30
FAM-SP-2 concentration (nM)
40
50
60
Figure 16.5
Increase in the binding rate coefficient, k, for a single-fractal analysis with an increase in the
FAM-SP-2 concentration (in nM) in solution.