Biomedical Engineering Reference
In-Depth Information
0.3
1
0.25
0.8
0.2
0.6
0.15
0.4
0.1
0.2
0.05
0
0
0
10
20
30
40
50
60
0
10
20
30
40
50
60
B
A
Time (min)
Time (min)
1.2
1
0.8
0.6
0.4
0.2
0
0
10
20
30
40
50
60
C
Time (min)
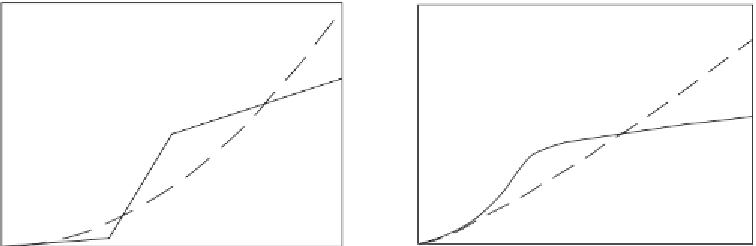
Figure 15.6
Binding and dissociation of PSA (protein specific antigen) to different gold nanocrystals for
immunoprobe concentrations (in M) in solution (
Cao et al., 2009
): (a) 0.65
10
7
,
10
7
. When only a solid line (--) is used then a single-fractal analysis
applies. When both a dashed (- - -) and a solid (--) line are used then the dashed line represents a
single-fractal analysis and the solid line represents a dual-fractal analysis.
10
7
, (c) 5.2
(b) 1.3
10
7
M immu-
noprobe concentration in solution (
Cao et al., 2009
). As mentioned, the detection of PSA-
ACT is based on the homogeneous growth of nanocrystals in the solution phase. For the
0.65
Figure 15.6a
shows the binding of the protein biomarker PSA-ACT to 0.65
10
7
M immunoprobe concentration a dual-fractal analysis is required to adequately
describe the binding kinetics. The values of (a) the binding rate coefficient
k
and the fractal
dimension
D
f
for a single-fractal analysis, and (b) the binding rate coefficients
k
1
and
k
2
and
the fractal dimensions
D
f1
and
D
f2
for a dual-fractal analysis are given in
Tables 15.3 and
15.4
.
Figure 15.6b
shows the binding of the protein biomarker, PSA-ACT to 1.3
10
7
M
immunoprobe concentration in solution (
Cao et al., 2009
). As before, the detection of
PSA-ACT is based on the homogeneous growth of nanocrystals in the solution phase. For
the 0.65
10
7
M immunoprobe concentration a dual-fractal analysis is required to ade-
quately describe the binding kinetics. The values of (a) the binding rate coefficient
k
and
the fractal dimension
D
f
for a single-fractal analysis, and (b) the binding rate coefficients