Biomedical Engineering Reference
In-Depth Information
120
100
100
80
80
60
60
40
40
20
20
0
0
0
50
100
150
Time (s)
200
250
300
350
0
50
100
150
200
250
300
350
B
A
Time (s)
50
25
40
20
30
15
20
10
10
5
0
0
0
50
100
150
200
250
300
350
0
50
100
150 200
Time (s)
250
300
350
C
D
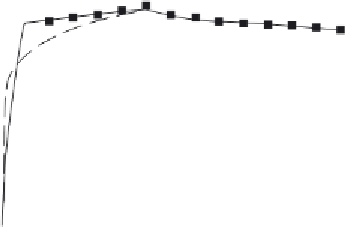
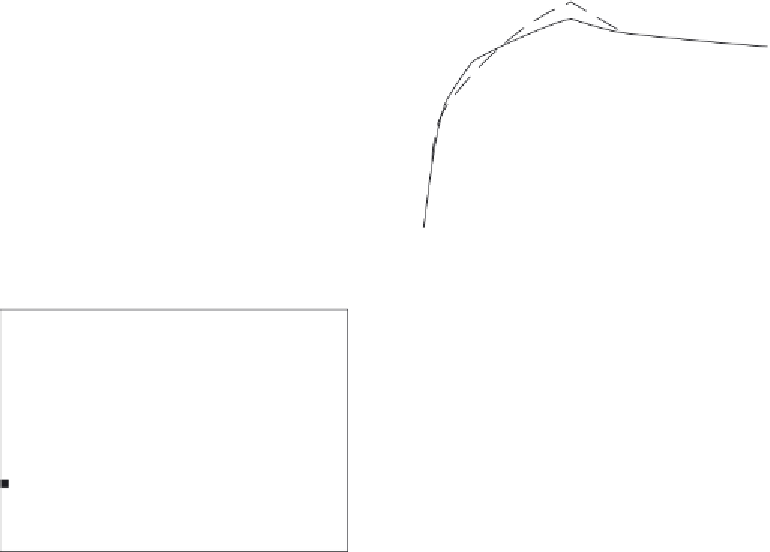
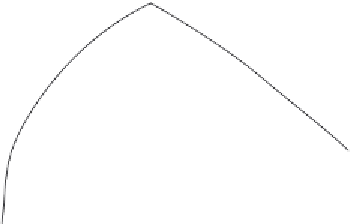
Figure 13.8
Binding of different rabbit IgG concentrations (in
Time (s)
M) in solution to A10B scFv (single-chain
fragment variable;
Tang et al., 2006
): (a) 1.3, (b) 0.53, (c) 0.20, (d) 0.067. When only a solid line
is used then a single-fractal analysis applies. When both a solid line and a dashed line are used,
then the dashed line is for a single-fractal analysis, and the solid line is for a dual-fractal analysis.
m
Table 13.6: Binding and dissociation rate coefficients for different concentrations of rabbit IgG in
solution engineered recombinant antibody A10B single chain variable (ScFv) (
Tang et al., 2006
).
Rabbit Concentration,
Micromole/Antibody A10B
k
k
1
k
2
k
d
1.3
85.189
60.167 21.714
16.878 86.841
0.358
1.237
0.056
0.53
20.39
17.35
10.767
8.486
29.893
0.452
1.172
0.032
0.20
12.061
10.406
na
na
0.0792
0.0061
0.067
3.022 0.449
na
na
0.0334 0.0007


