Biomedical Engineering Reference
In-Depth Information
0.09
0.036
0.034
0.08
0.032
0.07
0.03
0.028
0.06
0.026
0.05
0.024
0.022
0.04
0.02
0.018
0.03
0.6
0.8
1
1.2
1.4
1.6
1.8
2.2
2.3
2.4
2.5
2.6
2.7
A
B
Fractal dimension,
D
f
Fractal dimension,
D
fd
0.1
0.09
0.08
0.07
0.06
0.05
0.04
0.03
0.02
0
0.1
0.2
0.3
0.4
0.5
C
TNT concentration (
µ
g/L)
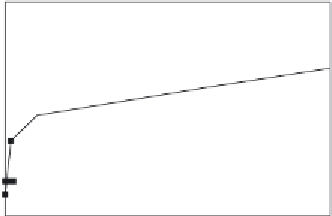
Figure 13.4
(a) Increase in the binding rate coefficient, k with an increase in the fractal dimension, D
f
.
(b) Increase in the dissociation rate coefficient, k
d
with an increase in the fractal dimension, D
fd
.
(c) Increase in the dissociation rate coefficient, k
d
with an increase in the TNT concentration
(in
g/L) in the ground water.
m
fractal dimension
D
fd
or the degree of heterogeneity that exists on the sensing surface as noted
by the order of dependence between four and one-half and five (equal to 4.65) exhibited.
Tables 13.3
and
13.4
and
Figure 13.4c
show the increase in the dissociation rate coefficient
k
d
with an increase in the TNT concentration in the 0 to 0.5
m
g/L range for a single-fractal
analysis. For the data shown in
Figure 13.4c
, the dissociation rate coefficient
k
d
is given by:
:
:
0
115
0
0495
k
d
¼ð
0
:
0816
0
:
0295
Þ½
TNT
ð
13
:
4c
Þ
The fit is good. Only five data points are available. The availability of more data points
would lead to a more reliable fit. The dissociation rate coefficient
k
d
exhibits a very low
(almost negligible; equal
to 0.115) order of dependence on the TNT concentration in
solution.