Biomedical Engineering Reference
In-Depth Information
Figure 12.7b
shows the binding of glucose to the SERS-based biosensor using an
in vivo
analysis.
Stuart et al. (2006)
reported that the SERS-based biosensor also effectively tracked
the change in the glucose concentration. A single-fractal analysis is, once again, adequate to
describe the binding kinetics. The values of the binding rate coefficient,
k
, and the fractal
dimension,
D
f
, for a single-fractal analysis are given in
Table 12.4
.
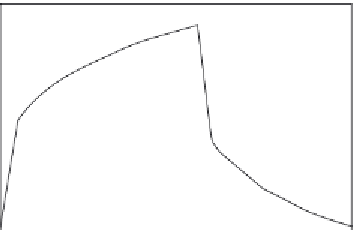
Figure 12.8
shows the binding of glucose to the SERS biosensor by an
ex vivo analysis
.
A dual-fractal analysis is required to adequately describe the binding kinetics. The values
of (a) the binding rate coefficient,
k
, and the fractal dimension,
D
f
, for a single-fractal analy-
sis, and (b) the binding rate coefficients,
k
1
and
k
2
, and the fractal dimensions,
D
f1
and
D
f2
,
for a dual-fractal analysis are given in
Table 12.4
.
It is of interest to note that as the fractal dimension increases by a factor of 1.95 from a value
of
D
f1
equal to 1.484 to
D
f2
equal to 2.8248, the binding rate coefficient increases by a
factor of 14.62 from a value of
k
1
equal to 12.140 to
k
2
equal to 177.54. The changes in
the degree of heterogeneity on the sensor surface or in the fractal dimension and in the bind-
ing rate coefficient are in the same direction.
Guo et al. (2007)
recently reported that noble metal nanoparticles such as Au (silver) or Ag
(gold) have been studied for their extraordinary size-dependent optical properties. They point
out that these nanoparticles exhibit a strong UV-vis absorption band. They explain that this
kind of absorption band is observed when the incident photon frequency is resonant with
the collective excitation of the conduction electrons.
Guo et al. (2007)
report that they have an improved method for the detection of Concanavlin
A (Con A) with label-free optical biosensors. These authors explain that 1-Dodecanethiol
(DDT) self-assembled onto gold nanoparticles were deposited on glass slides. Thereafter,
350
300
250
200
150
100
50
0
0
100
200
Time (s)
300
400
Figure 12.8
Binding and dissociation of ex vivo analysis using a real-time SERS sensor following a step change in
glucose concentration (
Stuart et al., 2006
).