Biomedical Engineering Reference
In-Depth Information
2.5
3.5
3
2
2.5
1.5
2
1.5
1
1
0.5
0.5
0
0
0
2
4 6
Time (min)
8
10
0
2
4 6
Time (min)
8
10
A
B
0.5
2.5
0.4
2
0.3
1.5
1
0.2
0.5
0.1
0
0
0
1
2
3
4
5
0
1
2 3
Time (min)
4
5
C
D
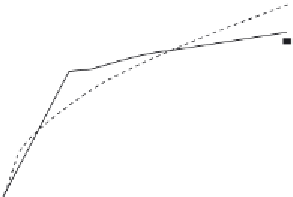
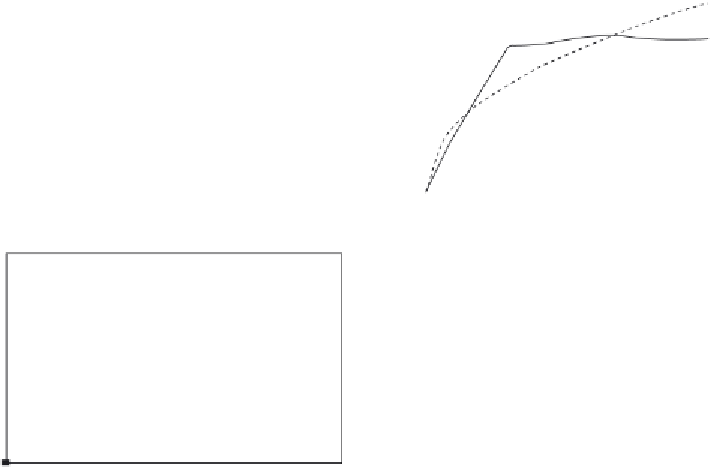
Figure 12.6
Binding (hybridization) in solution using differential surface plasmon resonance: (
Boecker et al.,
2007
): (a) 1
Time (min)
M DNA RS1 to RS1-c, (b) 1
M DNA RS2 to RS2-c, (c) 1
M DNA T2-c to T2,
m
m
m
M DNA G-c to G. When only a solid line (--) is used then a single-fractal analysis applies.
When both a dashed (- - -) and a solid (--) line are used then the dashed line represents a single-
fractal analysis and the solid line represents a dual-fractal analysis.
(d)1
m
It is of interest to note, once again, that as the fractal dimension increases by a factor of 2.26
from a value of
D
f1
equal to 1.2218 to
D
f2
equal to 2.7628, the binding rate coefficient
increases by a factor of 1.964 from a value of
k
1
equal to 0.7768 to
k
2
equal to 1.526. Once
again, changes in the degree of heterogeneity on the sensing surface or the fractal dimension
and in the binding rate coefficient are in the same direction.
Figure 12.6c
shows the binding of 1
m
M DNA T2-c in solution to T2 immobilized on the
sensing surface. A singe-fractal analysis is adequate to describe the hybridization (binding)
kinetics. The values of the binding rate coefficient,
k
, and the fractal dimension,
D
f
, for a
single-fractal analysis are given in
Table 12.3
.
Figure 12.6d
shows the binding of 1
m
M DNA G-c in solution to G immobilized on the
sensing surface. A singe-fractal analysis is adequate to describe the hybridization (binding)
kinetics. The values of the binding rate coefficient,
k
, and the fractal dimension,
D
f
, for a
single-fractal analysis are given in
Table 12.3
.