Biomedical Engineering Reference
In-Depth Information
Figure 12.2b
and
Table 12.1
show the increase in the binding rate coefficient,
k
2
, with an
increase in the fractal dimension,
D
f2
, for a dual-fractal analysis. For the data shown in
Figure 12.2b
, the binding rate coefficient,
k
2
is given by:
10
05
10
05
D
11
:
45
0
:
6492
:
04
k
2
¼ð
8
:
2
1
:
4
Þ
ð
12
:
4b
Þ
f2
The fit is very good. Only three data points are available. The availability of more data points
would lead to a more reliable fit. The binding rate coefficient,
k
2
, is extremely sensitive to the
fractal dimension,
D
f2
, as noted by the close to eleven and a half (equal to 11.45) order of
dependence exhibited on the fractal dimension,
D
f2
, on the sensor surface.
Figure 12.3
shows the binding and dissociation of 171 nM human IgG dosed on a protein-A
coated surface (
Schwartz et al., 2007
). A dual-fractal analysis is required to adequately model
the binding kinetics. The dissociation kinetics is adequately described by a single-fractal
analysis. The values of (a) the binding rate coefficient,
k
, and the fractal dimension,
D
f
, for
a single-fractal analysis, (b) the binding rate coefficients,
k
1
and
k
2
, and the fractal
dimensions,
D
f1
and
D
f2
, for a dual-fractal analysis and the dissociation rate coefficient,
k
d
and the fractal dimension,
D
fd
for a single-fractal analysis are given in
Table 12.2
.
It is of interest to note that as the fractal dimension increases by a factor of 1.53 fromvalue of
D
f1
equal to 1.8666 to
D
f2
equal to 2.8612, the binding rate coefficient increases by a factor of 48.67
from a value of
k
1
equal to 0.2832 to
k
2
equal to 13.782. The changes in the degree of heteroge-
neity on the sensing surface and in the binding rate coefficient are in the same direction.
Figure 12.4
shows the binding and dissociation of 51 nM human IgG dosed on a protein-A
coated surface (
Schwartz et al., 2007
). A dual-fractal analysis is required to adequately
describe the binding kinetics. A single-fractal analysis is adequate to describe the dissociation
kinetics. The values of (a) the binding rate coefficient,
k
, and the fractal dimension,
D
f
, for a
30
25
20
15
10
5
0
0
2000
4000 6000
Time (s)
8000
10,000
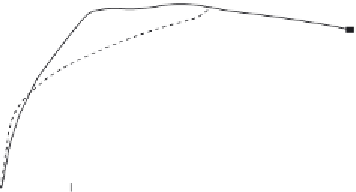
Figure 12.3
Binding and dissociation of human IgG on a protein A-coated biosensor surface
(
Schwartz et al., 2007
). When only a solid line (--) is used then a single-fractal analysis applies.
When both a dashed (- - -) and a solid (--) line are used then the dashed line represents a single-
fractal analysis and the solid line represents a dual-fractal analysis.