Biomedical Engineering Reference
In-Depth Information
30
30
25
25
20
20
15
15
10
10
5
5
0
0
0
500
1000
1500
Time (s)
2000
2500
3000
0
500
1000
1500 2000
Time (s)
2500
3000
3500
A
B
14
12
10
8
6
4
2
0
0
500
1000
1500 2000
Time (s)
2500
3000
3500
C
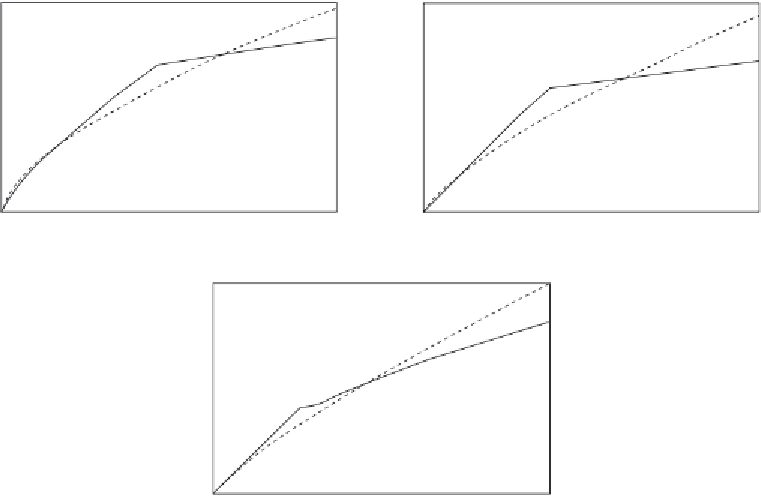
Figure 12.1
Binding of different IgG species to a porous SIO
2
interferometric biosensor coated with protein A
(
Schwartz et al., 2007
): (a) 171 nM protein A, (b) 171 nM rabbit IgG, (c) 171 nM goat IgG. When
only a solid line (--) is used then a single-fractal analysis applies. When both a dashed (- - -) and a
solid (--) line are used then the dashed line represents a single-fractal analysis and the solid line
represents a dual-fractal analysis. In this the solid line provides the better fit.
It is of interest to note that for a dual-fractal analysis, as the fractal dimension increases by a
factor of 5.05 from a value of
D
f1
equal to 0.4984 to
D
f2
equal to 2.5188, the binding rate
coefficient increases by a factor of 39.8 from a value of
k
1
equal to 0.0911 to
k
2
equal to
3.629. The changes in the degree of heterogeneity or the fractal dimension on the sensing
surface and in the binding rate coefficient are in the same direction.
Figure 12.1b
shows the binding of 171 nM rabbit IgG to a Protein A-coated porous SiO
2
sur-
face (
Schwartz et al., 2007
). A dual-fractal analysis is required to adequately describe the
binding kinetics. The values of (a) the binding rate coefficient,
k
, and the fractal dimension,
D
f
, for a single-fractal analysis, and (b) the binding rate coefficients,
k
1
and
k
2
, and the fractal
dimensions,
D
f1
and
D
f2
, for a dual-fractal analysis are given in
Tables 12.1
and
12.2
.
Once again, it is of interest to note that for a dual-fractal analysis, as the fractal dimension
increases by a factor of 2.32 from a value of
D
f1
equal to 1.1238 to
D
f2
equal to 2.6090,