Biomedical Engineering Reference
In-Depth Information
60000
35000
30000
50000
25000
40000
20000
30000
15000
20000
10000
10000
5000
0
0
0
20
40 60
Time (min)
80
100
0
20
40 60
Time (min)
80
100
B
A
20000
15000
10000
5000
0
0
20
40 60
Time (min)
80
100
C
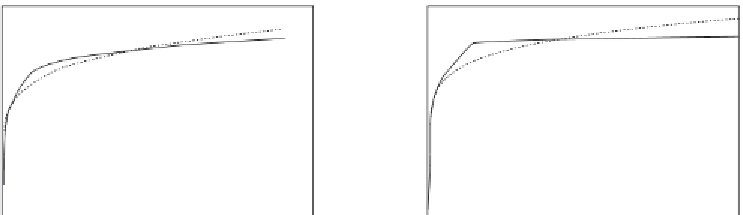
Figure 11.17
Binding (hybridization) of different concentrations of ss DNA in solution preincubated with
prehybridized 22-nt FQ duplex to a “broken beacon” immobilized on a sensor surface (
Blair et al.,
2007
): (a) 500 nM T. (b) 250 nM T. (c) 100 nM T. When only a solid line (--) is used then a
single-fractal analysis applies. When both a dashed (- - -) and a solid (--) line are used then the
dashed line represents a single-fractal analysis and the solid line represents a dual-fractal analysis.
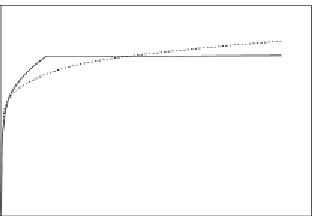
Figure 11.17c
shows the binding of the 100 nM target ss DNA (T) in solution in a “broken bea-
con” assay (
Blair et al., 2007
). A dual-fractal analysis is required to adequately describe the
binding kinetics. The values of (a) the binding rate coefficient,
k
, and the fractal dimension,
D
f
, for a single-fractal analysis, and (b) the binding rate coefficients,
k
1
and
k
2
, and the fractal
dimensions,
D
f1
and
D
f2
, for a dual-fractal analysis are given in
Tables 11.11
and
11.12
.
Once again, it is of interest to note that as the fractal dimension increases by a factor of
1.138 from a value of
D
f1
equal to 2.6278 to
D
f2
equal to 2.9916, the binding rate coefficient
increases by a factor of 1.632 from a value of
k
1
equal to 9171.31 to
k
2
equal to 14970.66.
Once again, and as above, it is seen that changes in the binding rate coefficient and in the
fractal dimension or the degree of heterogeneity on the sensor chip surface are in the same
direction.