Biomedical Engineering Reference
In-Depth Information
k
1
equal to 8.427 to
k
2
equal to 74.183. It is seen that changes in the fractal dimension or the
degree of heterogeneity on the sensor chip surface and in the binding rate coefficient are once
again in the same direction.
Figure 11.12d
shows the binding and dissociation of 0.1
m
M target DNA concentration in
solution to the probe PNA immobilized on the sensor surface. A single-fractal analysis is ade-
quate to describe the binding and the dissociation kinetics. The values of (a) the binding rate
coefficient,
k
, and the fractal dimension,
D
f
, for a single-fractal analysis, and (b) the dissoci-
ation rate coefficient,
k
d
, and the fractal dimension,
D
fd
, for a single-fractal analysis are given
in
Tables 11.7
and
11.8
. In this case, the affinity,
K
(
k
/
k
d
), is given by 1.046. No reason is
given at present as to why at this lowest DNA target concentration (0.1
m
M) in solution a sin-
gle-fractal analysis is adequate to describe the binding kinetics, whereas at the higher DNA
concentration in solution in the 1.0-5.0
m
M range, a dual-fractal analysis is required to ade-
quately describe the binding kinetics.
¼
In the entire 0.1-5.0
m
M target concentration range a single-fractal analysis is adequate to
describe the dissociation kinetics.
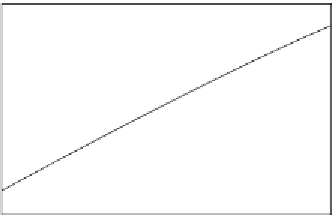
Figure 11.13a
and
Table 11.7
show the increase in the binding rate coefficient,
k
1
, with an
increase in the target DNA concentration in the 1.0-5.0
m
M range in solution for a dual-frac-
tal analysis. For the data shown in
Figure 11.13a
, the binding rate coefficient,
k
1
, is given by:
1
:
067
0
:
590
k
1
¼ð
10
:
67
10
:
27
Þ½
target DNA
ð
11
:
6a
Þ
The fit is not good. There is scatter in the data, and this is reflected in the error in the value of
the binding rate coefficient,
k
1
. The binding rate coefficient,
k
1
, exhibits close to a first (equal
to 1.067) order of dependence on the target DNA concentration in solution. The nonintegral
order of dependence exhibited by the binding rate coefficient,
k
1
, lends support to the fractal
nature of the system.
60
350
50
300
40
250
30
200
20
150
10
100
0
50
1
2 3
Target DNA concentration (micromole)
4
5
1
2 3
Target DNA concentration (micromole)
4
5
A
B
Figure 11.13
Increase in the binding rate coefficient (a) k
1
and (b) k
2
with an increase in the target DNA
concentration in (in micromole) in solution.


