Biomedical Engineering Reference
In-Depth Information
2.4
2.3
2.2
2.1
2
1.9
2
3
4
5
6
7
8
Initial-free DNA concentration (nM)
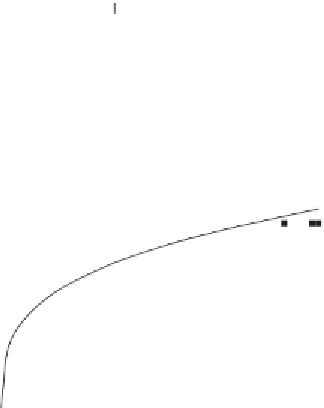
Figure 11.4
Decrease in the fractal dimension, D
f
, with an increase in the free-DNA concentration (in nM) in
solution.
0.1
0.08
0.06
0.04
0.02
0
0
1000
2000
3000
Time (s)
4000
5000
6000
Figure 11.5
Binding (hybridization) of 1 nM free-DNA concentration in solution to a 22 mer strand
(bound DNA) immobilized via a phenylene-diisocyanate linker molecule on a glass substrate
(
Michel et al., 2007
).
Figure 11.6a
shows the binding of nonmatching, noncomplementary strand m22 5
0
-Cy3-
TGA GCG TTC GTG GTG GGA TAG T-3
0
in solution to one strand (bound DNA; i22,
5
0
-NH
2
-C6-TTT TTT TTT TTT TTT TGA TAG GGT GGT GCT GGT GCT TGC GAG
T-3
0
) immobilized on a glass substrate (
Michel et al., 2007
). A single-fractal analysis is ade-
quate to describe the binding kinetics. The values of the binding rate coefficient,
k
, and the
fractal dimension,
D
f
, for a single-fractal analysis are given in
Table 11.3
.
Figure 11.6b
shows the binding of a matching sequence, complementary strand p22 5
0
-Cy3-ACT
CGC AAG CAC CAC CCT ATC-A-3
0
in solution to one strand (bound DNA; i22, 5
0
-NH
2
-C6
TTT TTT TTT TTT TTT TGA TAG GGT GGT GCT GGT GCT TGC GAG T-3
0
) immobilized