Biomedical Engineering Reference
In-Depth Information
The fit is good. Only three data points are available. The availability of more data points
would lead to a more reliable fit. The binding rate coefficient,
k
, for a single-fractal analysis
is very sensitive to the fractal presintering temperature as noted by the negative 9.8 order of
dependence exhibited.
At this point, the influence of presintering temperature on the binding rate coefficient,
k
,inthe
temperature range 673-873
K is not clear. Perhaps, there is an Arrhenius like dependence of
the form,
k
,where
A
and
k
0
are the coefficients as in the Arrhenius expression,
R
is the universal gas constant, and
T
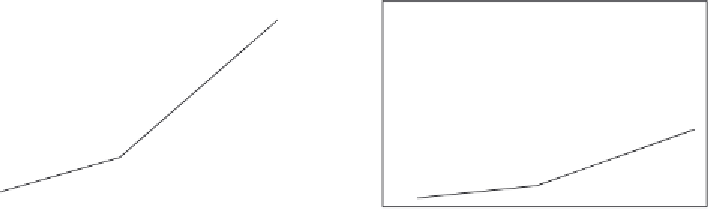
is the temperature in degree Kelvin. Thus, the data in
Figure 10.3e
are plotted again in
Figure 10.4a
with the reciprocal temperature in
K
1
as the inde-
pendent variable. For the data shown in
Figure 10.4a
, the binding rate coefficient,
k
, is given by:
¼
k
0
exp
ð
A
=
RT
Þ
9
:
81
1
:
26
10
28
10
28
T
1
,in
K
1
k
¼ð
:
:
Þð
Þ
ð
:
Þ
1
3
0
4
10
6a
Note that the coefficients in
Equation (10.5b)
and in
Equation (10.6a)
are very close to each
other, as expected. Once again, the fit is good.
2.5
6
5
2
4
1.5
3
1
2
0.5
1
0
0
0.0011
0.0012 0.0013
Temperature (K
−
1
)
0.0014
0.0015
0.0011
0.0012
0.0013
0.0014
0.0015
A
B
Temperature (K
−
1
)
8
6
4
2
0
650
700
750
800
850
900
C
Temperature (K)
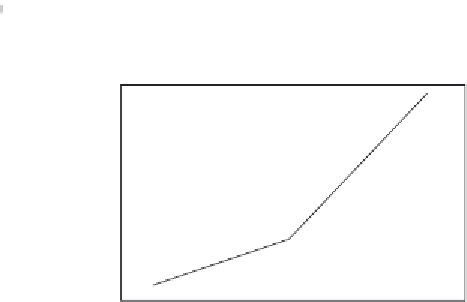
Figure 10.4
(a) Increase in the binding rate coefficient, k, with an increase in the reciprocal temperature, T
1
;
(b) increase in the dissociation rate coefficient, k
d
, with an increase in the reciprocal
temperature, T
1
; (c) increase in the affinity, K (
¼
k/k
d
), with an increase in the temperature, T.