Biomedical Engineering Reference
In-Depth Information
1.2
1.2
1
1
0.8
0.8
0.6
0.6
0.4
0.4
0.2
0.2
0
0
0
0.5
1
1.5
2
2.5
3
0
1
2
3
4
5
6
7
B
Time (s)
A
Time (s)
1.2
1
0.8
0.6
0.4
0.2
0
0
1
2
3
4
C
Time (s)
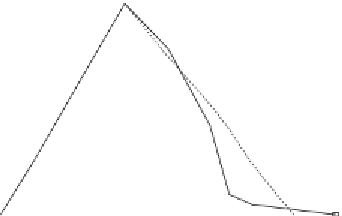
Figure 9.9
Binding and dissociation of TNXL and two other GECI (YC 2.0 and CGAMP1.6). Response kinetics
using identical stimulus conditions (AP frequency, 40 Hz, and 2.2 s) (
Mank et al., 2006
): (a) TNXL
(b) YC 2.0 (c) GCAMP1.6. When only a solid line (--) is used then a single-fractal analysis applies.
When both a dashed (- - -) and a solid (--) line are used then the dashed line represents a single-
fractal analysis and the solid line represents a dual-fractal analysis.
dissociation rate coefficient,
k
d
, and the fractal dimension,
D
fd
, for a single-fractal analysis,
and (c) the dissociation rate coefficients,
k
d1
and
k
d2
, and the fractal dimensions,
D
fd1
and
D
fd2
, for a dual-fractal analysis are given in
Tables 9.9
and
9.10
. Once again, an increase
in the degree of heterogeneity in the dissociation phase leads to an increase in the dissocia-
tion rate coefficient.
Figure 9.10
and
Tables 9.9
and
9.10
show the increase in the binding rate coefficient,
k
, with
an increase in the fractal dimension,
D
f
, for a single-fractal analysis. For the data shown in
Figure 9.10
, the binding rate coefficient,
k
, is given by:
D
0
:
816
0
:
615
k
¼
ð
0
:
7052
0
:
1896
Þ
ð
9
:
6
Þ
f
The fit is reasonable. Only three data points are available. The availability of more data
points would lead to a more reliable fit. The binding rate coefficient,
k
, exhibits less than a