Biomedical Engineering Reference
In-Depth Information
It is of interest to note that as the fractal dimension increases by a factor of 1.70 from a value
of
D
f1
equal to 1.0232 to
D
f2
equal to 1.7414, the binding rate coefficient increases by a fac-
tor of 17.1 from a value of
k
1
equal to 7
10
9
. Once again, an
increase in the degree of heterogeneity or the fractal dimension on the microband biosensor
surface leads to an increase in the binding rate coefficient.
10
11
to
k
2
equal to 1.2
Pemberton et al. (2009)
analyzed the binding of 50 mM glucose solution using the
microelectrodes under stirred conditions. They analyzed the binding using hydrodynamic
voltagrams under different applied potentials.
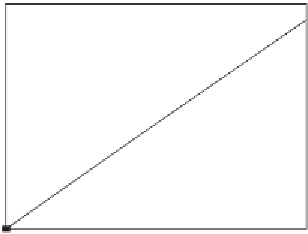
Figure 7.13a
shows the hydrodynamic
voltagram at an applied potential of 0.3 V. A single-fractal analysis is adequate to describe
the binding kinetics. The values of (a) the binding rate coefficient,
k
, and the fractal dimen-
sion,
D
f
, for a single-fractal analysis is given in
Table 7.9
.
2E-06
3E-07
2.5E-07
1.5E-06
2E-07
1.5E-07
1E-06
1E-07
5E-07
5E-08
0
0
1000
0
200
400
600
800
1000 1200 1400
0
500
1500
2000
A
B
Time (s)
Time (s)
5E-06
4E-06
3E-06
2E-06
1E-06
0
0
500
1000
1500
2000
2500
3000
C
Time (s)
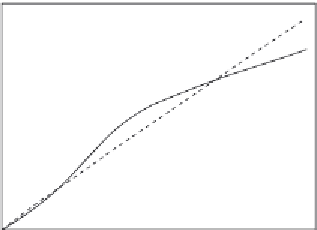
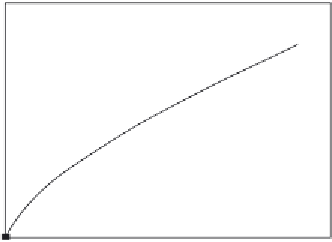
Figure 7.13
Binding of sequential (every 10 s) of 70
l additions of 50 mM glucose solution to the screen-
printed water-based (WB) CoPC microband biosensor using microelectrodes under stirred
conditions at different potentials (
Pemberton et al., 2009
): (a) 0.3V (b) 0.4V (c) 0.5V.
m