Biomedical Engineering Reference
In-Depth Information
220
200
180
160
140
120
100
80
60
0
50
100
150
200
Time (min)
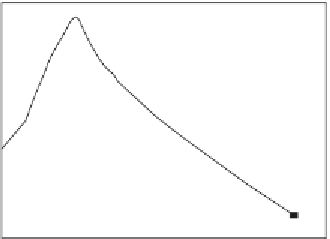
Figure 7.9
Binding of blood glucose in postmeal testing to a urine glucose meter (
Miyashita et al., 2009
).
100
80
60
40
20
0
0
20
40
60
80
100
120
Time (s)
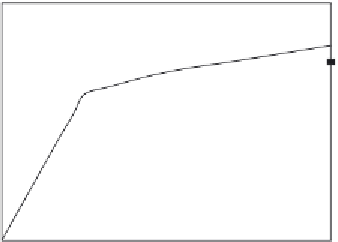
Figure 7.10
Binding of urine glucose in postmeal testing (elemental diet) (
Miyashita et al., 2009
).
It is of interest to compare the binding rate coefficient,
k
, and the fractal dimension,
D
f
,
observed for the postmeal testing of blood glucose and urine glucose by this urine glucose
meter. On going from the blood glucose to the urine glucose measurement, the single mea-
surement indicates a 15.56% increase in the fractal dimension value from a
D
f
value equal
to 2.2514 to 2.6040, which leads to a decrease in the binding rate coefficient,
k
value by a
factor of 0.622, from a value of
k
equal to 51.210 to 31.852. In this case, an increase in
the fractal dimension on the urine glucose sensor surface leads to a decrease in the binding
rate coefficient. It is observed, however, that two different systems (glucose in blood and glu-
cose in urine) are being analyzed by the same urine glucose meter.