Biomedical Engineering Reference
In-Depth Information
0.4
1
0.8
0.3
0.6
0.2
0.4
0.1
0.2
0
0
0
5
10
15
20
0
5
10
15
20
A
B
Elapsed time (days)
Elapsed time (days)
0.8
0.6
0.4
0.2
0
0
5
10
15
20
C
Elapsed time (days)
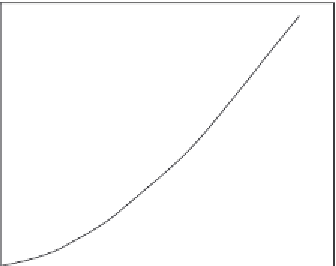
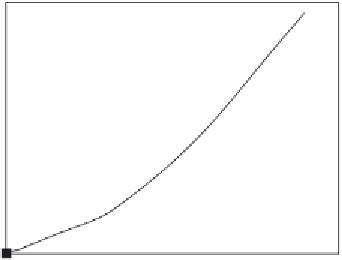
Figure 6.11
Binding of cancer cells to the implantable device: (a) Mouse 1 (b) Mouse 2 (c) Mouse 3.
Table 6.10: Binding rate coefficients for cancer monitoring in different mice (
Daniel et al., 2009
).
Mouse Number
k
k
1
k
2
#1
0.0000418 þ 0.000056
0.000057 þ 0.000073
0.000172 þ 0.00032
#2
0.003 þ 0.00084
na
na
#3
0.006243
0.002340
na
na
Table 6.11: Fractal dimensions for the
binding phase for cancer monitoring in
mice (
Daniel et al., 2009
).
Mouse Number
D
f
D
f1
D
f2
#1
0
þ
1.9242
0
0
#2
0
þ
0.3512
na
na
#3
0 þ 0.8212
na
na