Biomedical Engineering Reference
In-Depth Information
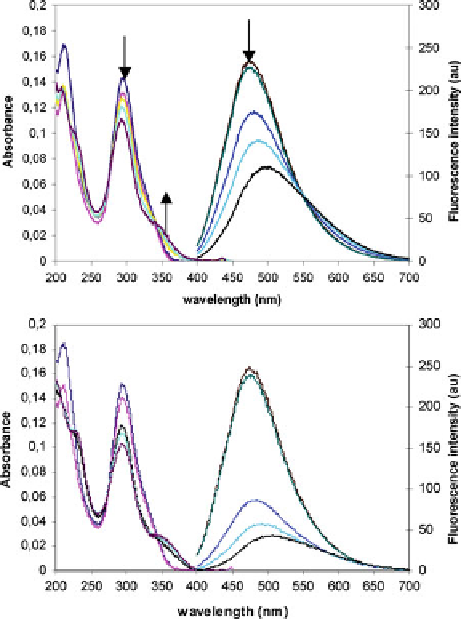
Fig. 16 UV-visible
absorbance (from 200 to
400 nm) and fluorescence
emission (l
exc
¼
340 nm)
spectra (from 400 to 700 nm)
of 16 (4.76
10
6
Min
acetonitrile) and upon
addition of increasing
concentrations of (
left
)Cd
(Tf)
2
(1-10 equiv.), (
right
)Zn
(Tf)
2
(1-10 equiv.) both in the
presence of Bu
4
NClO
4
(1.41
10
4
M)
complex if compared to Cd
2+
, and also as a result of a better “hard-to-hard”
interaction with oxygen.
In order to investigate the influence of the substituents in the biphenyl moiety on
sensing properties, compound 17 was studied under similar conditions. This ligand
is also able to form 1:1 complexes with Zn
2+
and Cd
2+
as triflate salts. In this case
however, the geometries of the complexes differ from those observed in ligand 16.
Thus, addition of either Zn
2+
or Cd
2+
to 17 brings about absolutely no change in
either the intensity or the wavelength of the maximum, indicating that the dihedral
angle in the TMB unit is not changed. This fact disproves the formation of a clamp
complex involving both crown cavities. On the other hand, the
1
H NMR studies
carried out with ligand 17 agree with a symmetrical structure for these complexes;
for all these reasons, a fast interchange, which makes both cavities equivalent on the
NMR time scale, seems to be the most likely complexation (Scheme
4
).
Compound 17 also displays interesting electrochemical behavior. The cyclic
voltammetric (CV) response of the receptor dissolved in acetonitrile (0.10 M
Bu
4
NPF
6
) is illustrated in Fig.
17a
. In the initial cathodic scan, two well-defined
reduction peaks appear at
1.02 (C1) and
1.94 V (C2), and the former is preceded
by a weak shoulder near
0.74 V (C3). In the subsequent anodic scan, an ill-defined
shoulder appears at
1.55 V (A2), followed by two overlapping peaks at
0.88
Search WWH ::

Custom Search