Biomedical Engineering Reference
In-Depth Information
DBA:iDIOL Combination IC
50
(mg/dL)
A)
DBA 1:iDIOL 3
>10,000
DBA 2:iDIOL 3
0.5
DBA 3:iDIOL 3
100
B)
DBA 3:iDIOL 1
>10,000
DBA 3:iDIOL 2
10,000
DBA 3:iDIOL 3
100
Fig. 11 IC
50
values from glucose competition response curves of various DBA:iDIOL
combinations
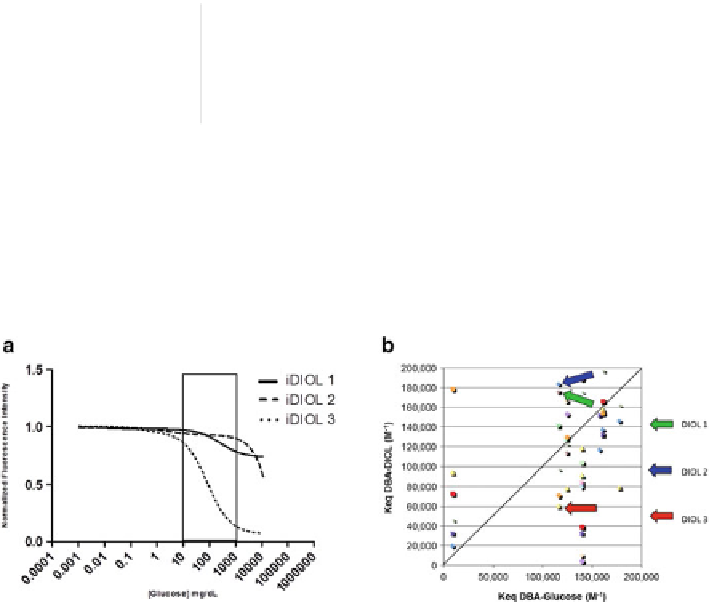
Fig. 12 Glucose competition curves showing the normalized DBA fluorescence intensity versus
glucose concentration of DBA 3 in a physiological buffer at neutral pH on an iDIOL 1, iDIOL 2,
and iDIOL 3 surface (a). Binding constants, in the Keq interaction graph, for DBA 3:glucose and
DBA 3:diol 1, 2, and/or 3 combinations were correlated with the glucose response curves of each
DBA:iDIOL system (b)
diol corresponding to iDIOL. The opposite is true for the diol corresponding to iDIOL
3, whose corresponding diol lies below the 1:1 line. These data correlate with the
observed glucose response curves, wherein iDIOL 1 and iDIOL 2 produce minimally
responsive curves while iDIOL 3 produced a competitive assay curve.
Although the above studies established the glucose sensitivity of the illustrated
DBA:iDIOL systems, it was also critical to determine glucose specificity. In a
representative selectivity study, the DBA 3:iDIOL 3 component pair was evaluated
for binding response relative to fructose and galactose (Fig.
14
), which are present
in vivo and could potentially interfere with the glucose response of the system.
Measurements were performed over a broad saccharide concentration range.
Upon addition of fructose and/or galactose, the DBA fluorescence intensity signal
changed very little due to the inability of fructose and/or galactose to bind to the
boronic acid receptors of the DBA. Therefore, the binding equilibrium of the DBA
with the iDIOL binding environment was undisturbed. These curves show that this
DBA:iDIOL pair is minimally cross-reactive with fructose or galactose.


Search WWH ::

Custom Search