Biomedical Engineering Reference
In-Depth Information
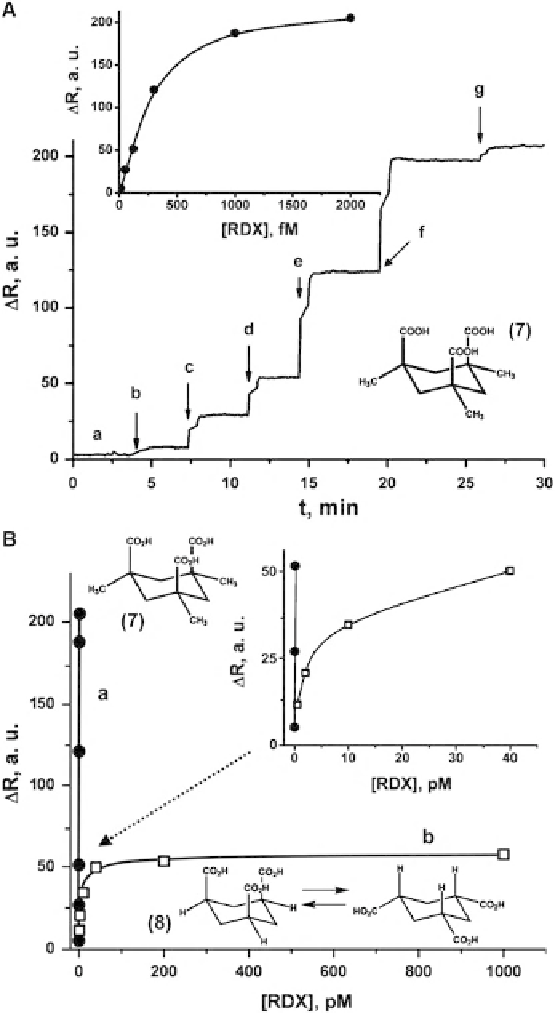
Fig. 5 (A) Sensogram, at
y ¼
63.3
, showing the reflectance changes obtained upon to the analysis of
RDX on the Kemp's acid-imprinted bis-aniline-cross-linked Au NPs matrix. RDX concentrations
analyzed:
a ¼
0Mandb-f:12fM-2pM.The
inset
presents the derived calibration curve for the
different RDX concentrations. (B) Comparison between the calibration curves obtained for the analysis
of variable concentrations of RDX on: (
a
) The Kemp's acid-imprinted Au NPs composite, and (
b
)the
cyclohexane tricarboxylic acid-imprinted Au NPs composite. The
inset
shows the lower concentration
region of the calibration curves. All measurements were performed in a 0.1 M HEPES buffer solution
Search WWH ::

Custom Search