Biomedical Engineering Reference
In-Depth Information
image needed is another parameter. The objective in establishing automated
stopping time is to remove a parameter, but if the solution requires another
parameter, then we would have accomplished nothing. The second problem of
this type of method is that it requires huge computational time to repeats the
filtered process. Therefore, we proposed a new automated stopping time (scale
selection) scheme that requires only one extra filtered image and low computa-
tional complexity.
This scheme is computationally simple because it utilizes the 'by-product'
from the previous procedure of establishing the diffusion strength function,
i.e., the local variance. This scheme encompasses only two simple steps: (1) Build
the local variance histogram (2) search the frequency of the mode of local variance
that begins to deteriorate (3) stopping scale is the scale before the identified local
variance in step 2. The motivation and intuitiveness of these steps are discussed
below.
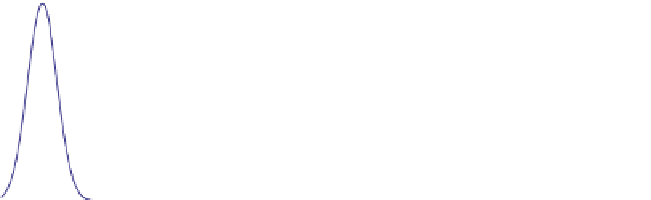
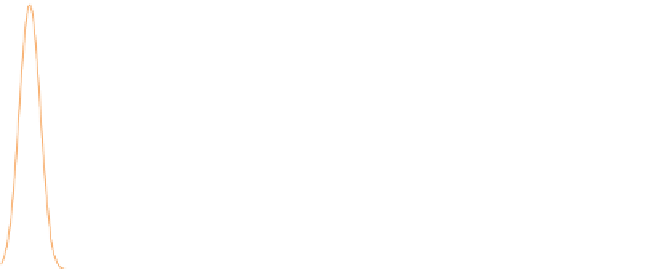
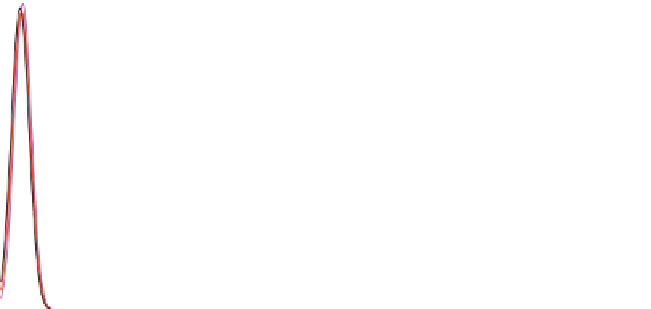
This hypo topic of the proposed scheme is intuitive. The number of pixels that
belongs to the category of relatively low local variance (potential homogenous
area) belongs to the category with highest number of pixels. Therefore, when the
diffusion begins to iterate, those smoothed pixels will monotonically increases
until homogeneity is saturated, then the number of homogenous pixels begins
to drop, and this is when the high variance pixels (edges) begins to be smoothed
which is undesirable. Hence, we propose that the iteration has to be halted before
the frequency of the mode of local variance begins to drop. This idea is illustrated
in Fig.
3.7
by performing the diffusion on the standard image used in last chap-
ter with all parameters preset as constant, the iteration number as manipulated
x 10
5
Original
Original
1 iteration
1 iteration
2 iterations
2 iterations
3 iterations
3 iterations
4 iterations
4 iterations
5 iterations
5 iterations
6 iterations
6 iterations
3.5
3
2.5
2
1.5
1
0.5
0
0
10
20
30
40
50
60
70
80
90
Local variance
Fig. 3.7
Histogram of local variance


Search WWH ::

Custom Search