Biomedical Engineering Reference
In-Depth Information
3.5
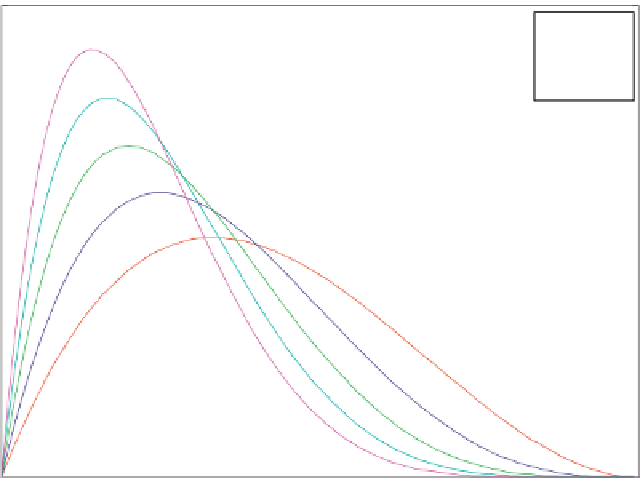
m=2,n=3
m=2,n=4
m=2,n=5
m=2,n=6
m=2,n=7
3
2.5
2
1.5
1
0.5
0
0
0.1
0.2
0.3
0.4
0.5
0.6
0.7
0.8
0.9
1
Relative Brightness Difference (RBD)
Fig. 3.5
Illustration of the relationship between
RBD
and
BPS
when both the shape parameters
are not equivalent: asymmetrical triangular shaped distribution with peak at different value of
RBD
. These five curves demonstrate the effect of five different values of manipulated param-
eter n with constant parameter m
=
5 on the shape of
BPS
function: as both shape parameters
increase, the curve spread and falls off unevenly
1
|
σ
y
−σ
x
|
σ
x
+
c
RCD
=
+
c
(3.6)
where
σ
y
= σ
x
if
σ
y
>σ
x
(3.7)
2
N
−
1
M
−
1
1
MN
x
i
,
j
x
max
(3.8)
σ
x
=
− µ
x
i
=
0
j
=
0
2
N
−
1
M
−
1
1
MN
x
i
,
j
x
max
(3.9)
σ
y
=
− µ
y
i
=
0
j
=
0


Search WWH ::

Custom Search