Biomedical Engineering Reference
In-Depth Information
6
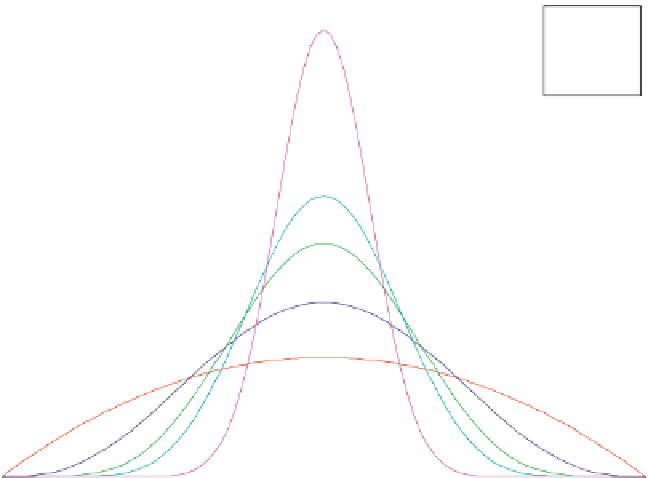
m=n=2
m=n=4
m=n=7
m=n=10
m=n=25
5
4
3
2
1
0
0
0.1
0.2
0.3
0.4
0.5
0.6
0.7
0.8
0.9
1
Relative Brightness DIfference (RBD)
Fig. 3.3
Illustration of the relationship between
RBD
and
BPS
when both the shape parameters
are equivalent: symmetrical with a central peak at 0.5 of
RBD
. The five curves in the figure dem-
onstrate the effect of five different values of equivalent shape parameters on the shape of
BPS
function: as both shapes parameters increase, the curve spread and falls off evenly
normalized
BPS
that produces bound output values between 0 and 1; this bound
output property is of prime importance to compare other measurements which will
be defined later.
The
NBPS
of value 1 indicates perfect brightness preservation, whereas
NBPS
value close to 0 indicates poor brightness preservation. In other words, the more
the
NBPS
approaches 1, the more perfect the brightness preservation. But how
large is considered as 'large'? This ambiguity is explained by m and n; different
values of m and n define different values of
RBD
required for favorable bright-
ness preservation. For example, as illustrated in the Fig.
3.6
, the red line, which
is formed by using m
=
2, n
=
3 demonstrates that, for instance, if the
RBD
falls
near 3.3, the histogram equalization has better performance in brightness preserv-
ing than histogram equalization algorithm that produces
RBD
around 3.2 or 3.8.
As the figure illustrates, the
RBD
is around 3.3, compared to
RBD
around 3.2 or
3.8, produces higher
NBPS
. As shown in the Figs.
3.4
and
3.6
, different values of
m and n determine the value of
RBD
should have in order to produce high
NBPS
.
In other words, the
NBPS
function regularizes the definition of 'good' or 'bad'
brightness preserving ability, in terms of
RBD
.


Search WWH ::

Custom Search