Biomedical Engineering Reference
In-Depth Information
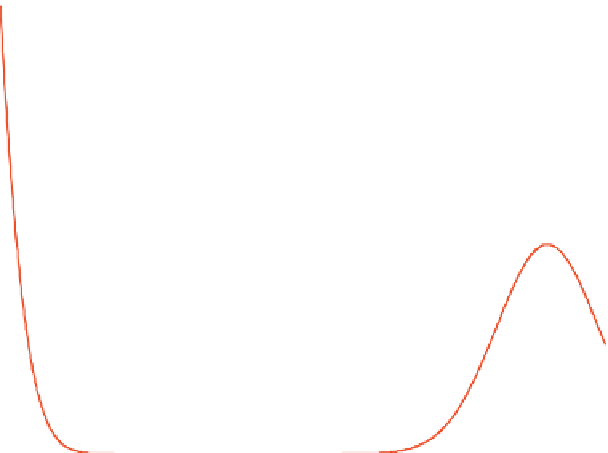
150
Number of Intensity vs Pixel Intensity Bin
Multiple Gaussian Model
Third inflection point
100
Second inflection point
50
0
0
50
100
150
200
250
8 bit Gray-scale pixel intensity bin
Fig. 3.23
The histogram of segmented bone image of Fig.
3.20
b and its interpolated Gaussian
graph with second inflation point and third inflation point
diffusion is utilized as the pre-processing of the edge detection, follows by GLCM
entropy based edge detection technique, then lastly, utilize the unsupervised clus-
tering technique to separate the noises and edge pixels. This proposed technique
share a similar concept to ACR segmentation and therefore it could utilize the by-
products of previous processing techniques to prevent the wastage of information
and increase the computational efficiency in detecting the edges. Besides, through
comparisons with other conventional method, this technique has been proven to be
more robust, the comparison result is shown in next chapter. The algorithm details
of the proposed edge detection method are described next:
An intuitive solution is to use the entropy as a quantitative measurement of
information content, originated from information theory of Shannon [
21
]. This
measurement enables the assessment of the randomness of the pixel intensity dis-
tribution in hand bone image. Mathematically, it is represented by the following
equation:
N
−
1
N
−
1
Entropy
=−
P
(
i
,
j
)
lnP
(
i
.
j
)
(3.64)
i
j
where
P
(
i
,
j
)
depicts the probability a group of spatial related pixel intensity
occur in the image.
N
depicts the adopted gray level. The entropy reaches its
maximum value, which is 0.5 only when all
P
(
i
,
j
)
are equally distributed. On the


Search WWH ::

Custom Search