Biomedical Engineering Reference
In-Depth Information
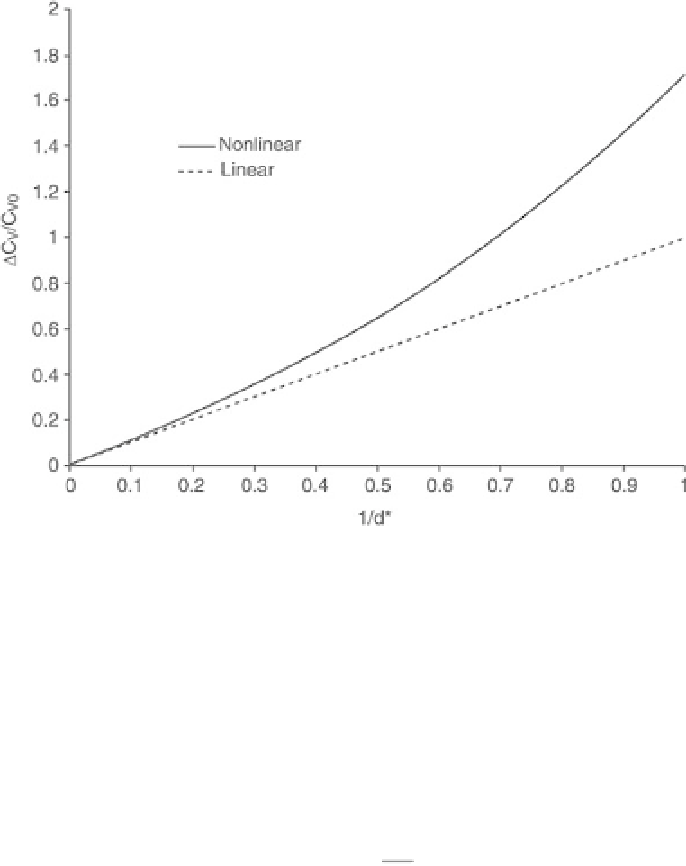
13.1 Schematic comparison of vacancy concentration as a function of
particle size between linear approximation and non-linear equation.
transport should be given as
gk
O
kT
gk
O
kT
D
C
n
¼
C
n
0
exp
C
n
0
¼
C
n
0
exp
1
½
13
:
4
Equation 13.4 shows that the driving force for mass transport during
sintering is a nonlinear function of the surface curvature, and it increases
exponentially when particle size decreases to nanoscale. Figure 13.1
schematically illustrates the relationship of
D
C
n
gk
O
kT
¼
1
d
, where d*is
related to the particle size. This nonlinear relationship of the driving force
for sintering of nano particles is expected to have a dramatic effect on the
kinetics of sintering.
The driving force of sintering of nano particles is also affected by specific
surface energy -
C
n
0
vs
:
is also a function of the particle size.
Campbell et al.
9
studied the effect of size-dependent nano particle energetics
on catalyst sintering. By using microcalorimetric measuring the heat of
adsorption of Pb onto MgO (100), they showed that the surface energy
increases substantially as the radius decreases below
γ
. The value of
γ
~
3 nm, as shown in
Fig. 13.2.
Independently, Nanda et al.
10
showed that the surface energy of nano
particles is significantly higher than that of the bulk, as demonstrated by
studying size-dependent evaporation of Ag nano particles.