Biomedical Engineering Reference
In-Depth Information
9.10
Heat capacity vs. temperature for SC polymer-ceramic samples
obtained with different ratios of ceramic:i-PP. Y
1
Ba
2
Cu
3
O
6.97
:i-PP = 85:15
(curve 1), 70:30 (curve 2), 50:50 (curve 3); pure i-PP (curve 4) [25].
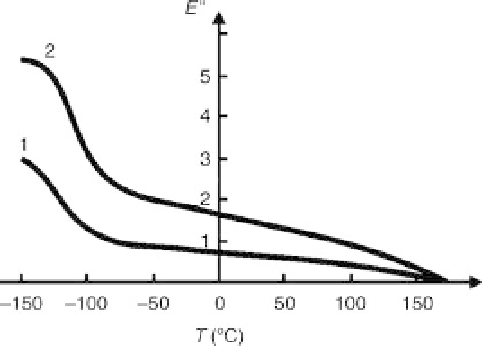
9.11
for pure SHMPE (curve 1) and
SHMPE-ceramic nanocomposite (curve 2); ceramics content (wt%)
= 15% [25].
Temperature dependence of
E
related to a relaxation process. The broad melting region of SHMPE from
about 50
8
C up to 170
8
C yields a further softening of the samples and a large
δ
δ
peak in tan
. With an increasing amount of ceramic filler, the peaks in tan
are increased and shifted to higher temperatures (see Fig. 9.12).
It should be noted that the observed change in the loss tangent curves is a
rare feature for conventional, non-nanosized ceramic polymer nanocompo-
sites [36, 37]. Increasing mechanical loss peaks have been linked with the
plate-like structure of the filler [38]. It seems that, in the present case, we
have the reverse situation. Some parts of the macromolecules penetrate by
intercalation mechanisms into the sandwich structure of the filler, thus
creating effects similar to that shown in curve 2 of Fig. 9.12.
The increase in mechanical loss cannot be explained by the agglomeration