Biomedical Engineering Reference
In-Depth Information
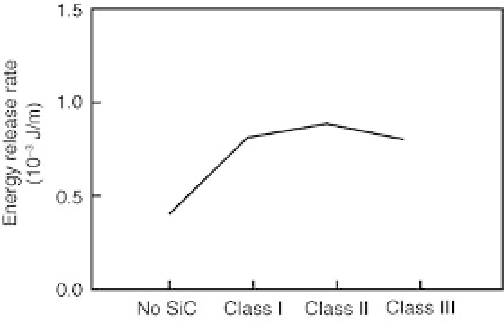
5.11 Mean energy release rate values as a function of microstructure at
loading velocity of 2m/sec. No SiC is a control microstructure with no
SiC particles.
shown to restrict the damage to grain interior. However, SiC particles
primarily determine how soon the structure develops microcracks.
Self-reinforced Si
3
N
4
is an important example of the high-toughness
structural ceramics first manufactured during 1970s. Embedding nanosized
SiC particles in a Si
3
N
4
matrix is one proven approach to improve its
mechanical properties. It is also verified here by comparing the average
energy release rate of all the microstructures with that of a control
microstructure that contains no SiC particles at all (Fig. 5.11). As shown, a
significant increase in the fracture resistance is observed. For the first time,
Niihara [1] reported almost 200% improvements in both the fracture
toughness and the strength of SiC-Si
3
N
4
nanocomposites by embedding
nanometer size (20-300 nm) particles within a matrix of larger grains and at
the Si
3
N
4
GBs. Since then, a number of experiments focusing on
manufacturing SiC-Si
3
N
4
nanocomposites have been reported [2, 53]. So
far it has been very difficult to control the processing routes and conditions
to place SiC particles selectively along GBs. However, it is possible to place
second-phase particles in a combination that places them along GBs as well
as in grain interiors near GBs, which may ultimately result in very high
strength SiC-Si
3
N
4
nanocomposites [14]. Such mechanisms have been
observed for other SiC particle reinforced nanocomposites [85, 86].
Figure 5.12 shows stress-displacement plots for atomistic microstructures
M1 to M6 in order to compare the internal stresses when an initial crack is
present in all microstructures with the internal stresses when the initial crack
is absent in all the microstructures. Figures 5.13 and 5.14 show visuals of
crack propagation as a function of total displacement for microstructures
M1, M2, M4, and M6. The results from Figs 5.12 to 5.14 are now
collectively discussed.
As shown in Fig. 5.12(a), microstructures M1 and M2 have the same

