Biomedical Engineering Reference
In-Depth Information
Pyrrole compositions in samples
36
Table 3.4
Sample
Amount of pyrrole, x (ml)
S1
0.50
S2
0.65
S3
0.80
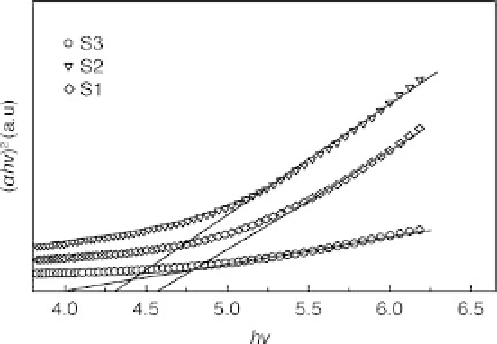
3.19 Plot of (αh
n
)
2
versus h
n
for different nanocomposite samples
(Table 3.4) to determine optical bandgap.
36
*
transition
of polypyrrole shifts from 3.9 eV to 4.58 eV. Samples with three different
concentrations of pyrrole were prepared, as shown in Table 3.4.
Generally, the optical bandgap in a semiconductor is determined by
plotting absorption coefficients (
concentration the optical absorption spectra showed that the
π
-
π
)
1/m
against h
α
)as(
α
h
where m represents
n
n
the nature of the transition and h
is the photon energy; m may have
different values, such as 1/2, 2, 3/2 or 3 for allowed direct, allowed indirect,
forbidden direct and forbidden indirect transitions, respectively. The optical
absorption coefficient
n
α
near the absorption edge for direct interband
transitions is given by:
37
1
=
2
B
ð
h
n
E
g
Þ
a ¼
½
3
:
6
h
n
where B is the absorption constant for a direct transition. For an allowed
indirect transition, one can plot (
)
2
against h
α
h
, as shown in Fig. 3.19, and
n
n
extrapolate the linear portion of it to
=0 to obtain the corresponding
bandgap. The estimated bandgaps are 4.58, 4.30 and 3.90 eV for S1, S2 and
S3 respectively. The increase of bandgap with silica concentration implies
that the electronic structure of polypyrrole is affected by silica.
36
α