Biomedical Engineering Reference
In-Depth Information
(A)
(C)
S
= −
ve
•
P
u
Time (s)
Displacement (nm)
(B)
(D)
•
h
h
S
c
Displacement (nm)
Time (s)
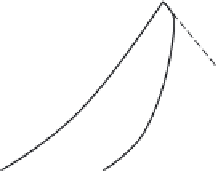
FIGURE 16.5
Schematic representations of the data obtained from
nanoindentation of viscoelastic materials. The load-displacement
curve for a (A) triangular load function, (B) trapezoidal load function
with sufficient hold and fast unloading rate. (C) the load-time
graph and (D) the displacement-time graph for the trapezoidal load
function (
S
c
apparent contact stiffness,
P
u
unloading rate, and
h
h
viscoelastic creep rate at holding).
In eon (11),
h
h
is the viscoelastic creep rate during the holding period as a result of the viscous
component in the biological tissues and approximates the rate of downward viscoelastic creep rate on
unloading
h
v
.
h
h
is numerically subtracted from the apparent contact stiffness to achieve the corrected
contact stiffness
P
h
u
S
(16.13)
e
e
which is reflective of the elastic property of the material. With
S
e
, Eqs. (16.1)-(16.4) can now be used
for computing
h
c
,
H
,
E
r
, and
E
that are free from viscoelastic effects.
16.3.5
Microstructural Influence
Biological tissues are a challenging class of materials for mechanical characterization since they have
hierarchical structures with important features down to the nanometer or micrometer scale. To ful-
fill the load bearing function of mineralized tissues, their mechanical properties often vary gradually
across the entire tissue, as in the dentin-enamel junction, such that the resulting stress distribution


