Biomedical Engineering Reference
In-Depth Information
Bare Ti- 6Al- 4V
TiO
2
nanoparticles-
coated Ti- 6Al- 4V
Bare Ti- 6Al- 4V
TiO
2
nanoparticles-
coated Ti- 6Al- 4V
(B)
0.00
(A)
0.1
-0.05
0.0
-0.10
-0.1
-0.15
-0.2
-0.20
-0.3
-0.25
-0.4
-0.30
-0.5
-0.35
-0.6
-8.0 -7.5 -7.0 -6.5 -6.0 -5.5 -5.0 -4.5 -4.0 -3.5 -3.0 -2.5
0
5000 10000 15000 20000 25000 30000 35000 40000
log<
I
> ( mA)
Time (s)
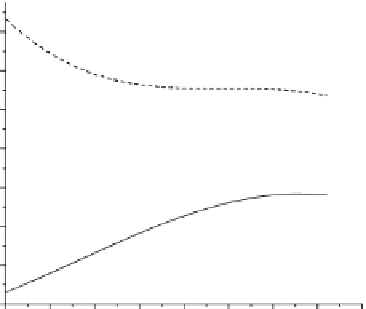
FIGURE 9.4
OCV (A) Tafel analysis results (B) for the bare and the TiO
2
nanoparticle-coated Ti6Al4V in simulated biological
NaCl solution. (Copyright permission from Springer [24].)
The electrochemical techniques, including OCV, Tafel analysis, and EIS, were conducted using a
VMP2/Z multichannel potentiostat (PAR, TN), controlled by EC-lab Win 9.01. In Tafel experiment,
scan rate at 1 mV/s and the scan range of
25 mV of open-circuit potential were used after the speci-
mens have reached stable E
corr
. All potentials were measured with respect to Ag/AgCl reference elec-
trode (CH Instruments, TX). The EIS measurements were obtained in the potentiodynamic mode with
voltage perturbation amplitude of 10 mV in the frequency range 100 kHz to 10 mHz. The equivalent
electrical circuit models were developed by ZSimpwin 3.21 (EChem Software).
9.4.1
OCV and Tafel Analysis
OCV is the other typical techniques to evaluate the corrosion behaviors.
Figure 9.4A
shows the OCV
of the bare and the TiO
2
nanoparticle-coated Ti6Al4V in simulated biological NaCl solution. When
the uncoated Ti6Al4V were exposed to NaCl solution, the initial open-circuit potential is about
0.56 mV and then it gradually increased to a steady value of
0.32V.
The initial potential of the TiO
2
nanoparticles-coated Ti6Al4V was 0.134V and then it decreased
to
0.064V.
Figure 9.4B
shows the polarization curves of the bare and the TiO
2
nanoparticle-coated Ti6Al4V
in simulated biological NaCl solution.
It is found that the average corrosion potential estimated of the uncoated Ti6Al4V is
0.316V,
while TiO
2
nanoparticle-coated Ti6Al4V alloy in NaCl solution is
0.07V. Moreover, the corrosion
current was obtained from the polarization curves by extrapolation of the anodic and the cathodic
branches of the polarization curve to the corrosion potential. The bare Ti electrode has a higher
I
corr
compared to TiO
2
nanoparticle-coated Ti6Al4V substrate, 0.004 and 0.002 μA, respectively.