Biomedical Engineering Reference
In-Depth Information
i
(A)
RT
0.14
0.12
0.10
0.08
0.06
0.04
0.02
0.00
Actual
Standard
400 500
Raman shift (cm
-1
)
600
700
(B)
ii
400ºC
0.14
0.12
0.10
0.08
0.06
0.04
0.02
0.00
Actual
Standard
400 500
Raman shift (cm
-1
)
600
700
(C)
iii
700ºC
0.14
0.12
0.10
0.08
0.06
0.04
0.02
0.00
Actual
Standard
400 500
Raman shift (cm
-1
)
600
700
1
2
i-iv,
1000ºC
1.0
0.8
Actual
Standard
0.6
4
3
0.4
0.2
0.0
400 500
Raman shift (cm
-1
)
600
700
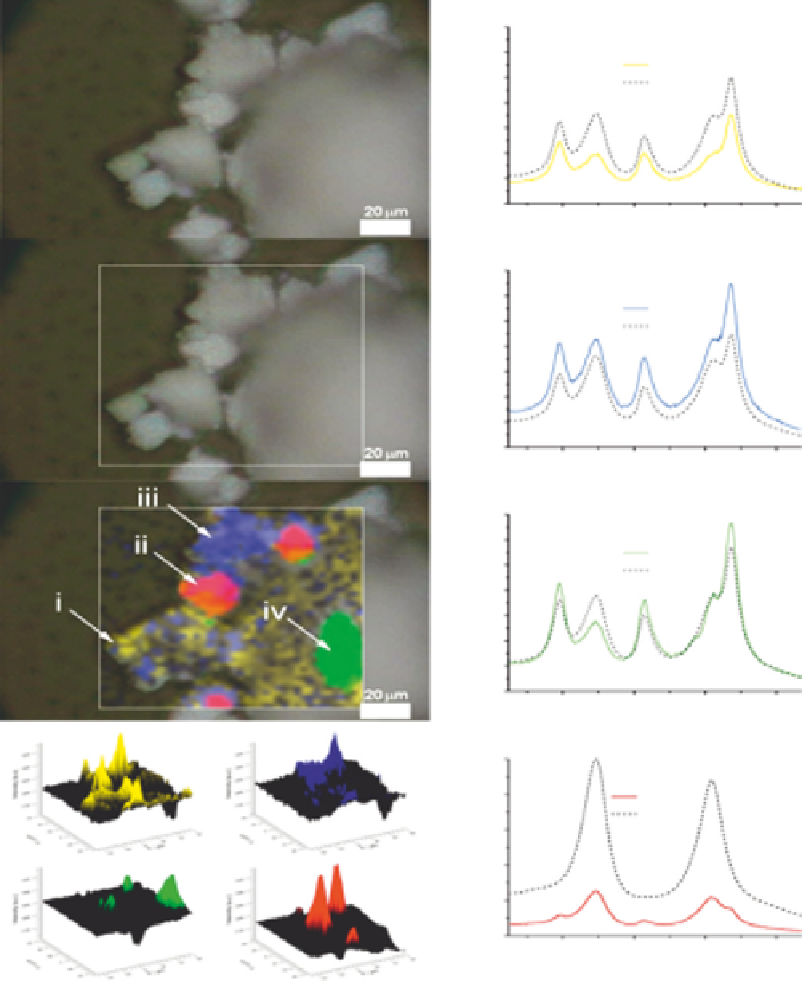
FIGURE 9.3
Images from the RT sample; bright field view (A) and Raman map area (B). Arrow points indicate
various components within the sample; RT component (i), 400°C component (ii), 700°C component
(iii), and 1,000°C component (iv). Actual spectra for each arrow (C) are compared with each (Figure
9.2) TiO
2
standard (i-iv). 3D surface figures for each component (1-4), corresponding to components
i-iv, are shown to give a phase distribution (C).